Panamanian vs Immigrants from Cambodia Male Unemployment
COMPARE
Panamanian
Immigrants from Cambodia
Male Unemployment
Male Unemployment Comparison
Panamanians
Immigrants from Cambodia
5.6%
MALE UNEMPLOYMENT
1.9/ 100
METRIC RATING
225th/ 347
METRIC RANK
5.6%
MALE UNEMPLOYMENT
1.8/ 100
METRIC RATING
226th/ 347
METRIC RANK
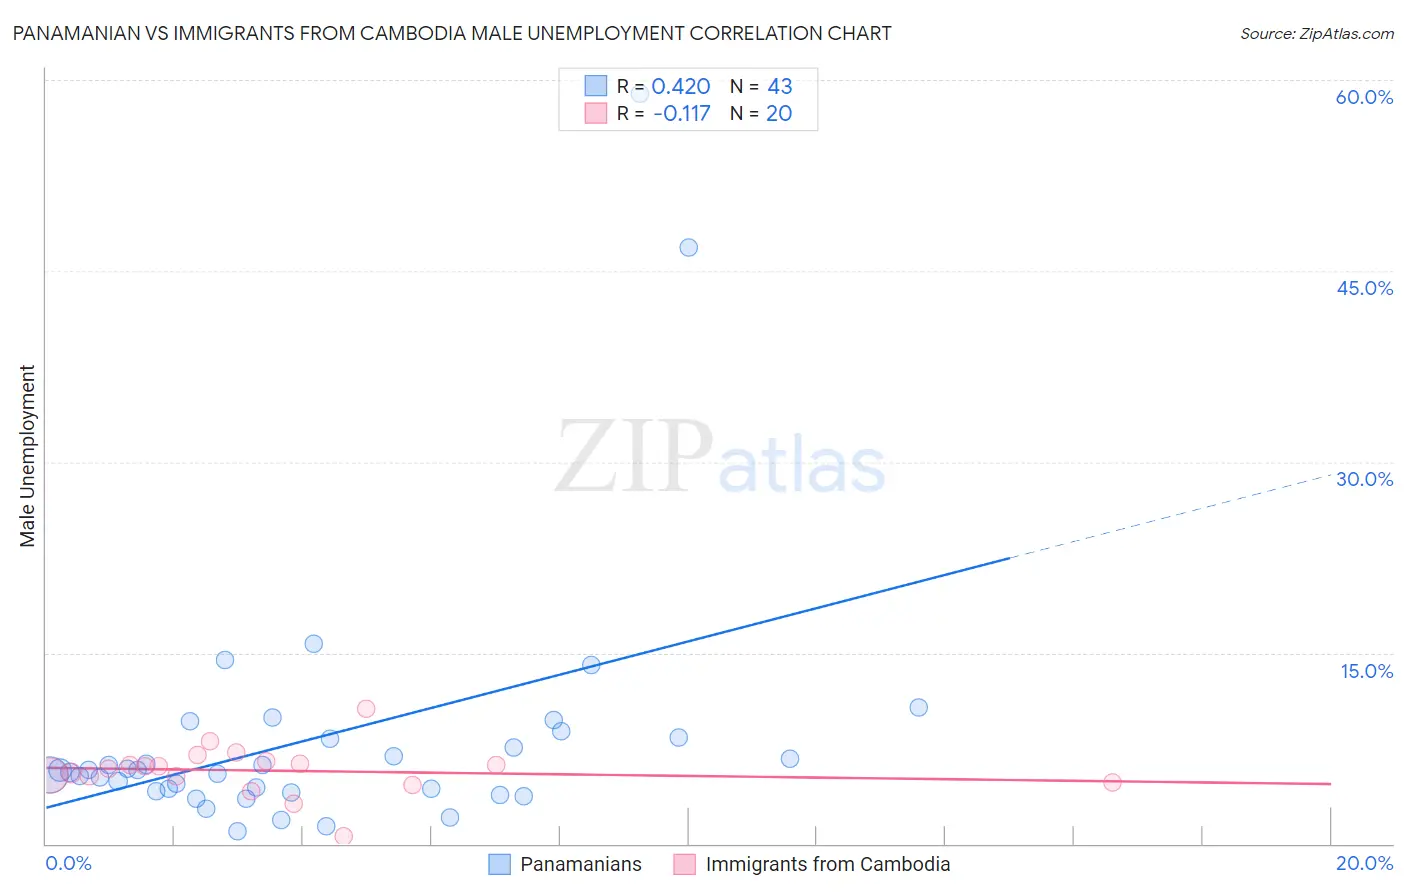
Panamanian vs Immigrants from Cambodia Male Unemployment Correlation Chart
The statistical analysis conducted on geographies consisting of 280,561,708 people shows a moderate positive correlation between the proportion of Panamanians and unemployment rate among males in the United States with a correlation coefficient (R) of 0.420 and weighted average of 5.6%. Similarly, the statistical analysis conducted on geographies consisting of 204,980,262 people shows a poor negative correlation between the proportion of Immigrants from Cambodia and unemployment rate among males in the United States with a correlation coefficient (R) of -0.117 and weighted average of 5.6%, a difference of 0.090%.
Male Unemployment Correlation Summary
| Measurement | Panamanian | Immigrants from Cambodia |
| Minimum | 1.0% | 0.60% |
| Maximum | 58.9% | 10.6% |
| Range | 57.9% | 10.0% |
| Mean | 8.4% | 5.7% |
| Median | 5.8% | 6.0% |
| Interquartile 25% (IQ1) | 4.2% | 5.1% |
| Interquartile 75% (IQ3) | 8.3% | 6.4% |
| Interquartile Range (IQR) | 4.1% | 1.3% |
| Standard Deviation (Sample) | 10.5% | 2.0% |
| Standard Deviation (Population) | 10.4% | 1.9% |
Demographics Similar to Panamanians and Immigrants from Cambodia by Male Unemployment
In terms of male unemployment, the demographic groups most similar to Panamanians are Immigrants from Panama (5.6%, a difference of 0.090%), Seminole (5.6%, a difference of 0.11%), Central American (5.6%, a difference of 0.11%), Immigrants from Africa (5.6%, a difference of 0.15%), and Choctaw (5.6%, a difference of 0.20%). Similarly, the demographic groups most similar to Immigrants from Cambodia are Immigrants from Panama (5.6%, a difference of 0.0%), Seminole (5.6%, a difference of 0.020%), Central American (5.6%, a difference of 0.030%), Immigrants from Africa (5.6%, a difference of 0.060%), and Choctaw (5.6%, a difference of 0.12%).
| Demographics | Rating | Rank | Male Unemployment |
| Samoans | 4.9 /100 | #215 | Tragic 5.5% |
| Immigrants | Immigrants | 4.3 /100 | #216 | Tragic 5.5% |
| Delaware | 4.2 /100 | #217 | Tragic 5.5% |
| Immigrants | Albania | 3.6 /100 | #218 | Tragic 5.5% |
| Immigrants | Western Asia | 3.5 /100 | #219 | Tragic 5.6% |
| Portuguese | 3.5 /100 | #220 | Tragic 5.6% |
| Soviet Union | 3.2 /100 | #221 | Tragic 5.6% |
| Immigrants | Micronesia | 2.9 /100 | #222 | Tragic 5.6% |
| Creek | 2.6 /100 | #223 | Tragic 5.6% |
| Cherokee | 2.4 /100 | #224 | Tragic 5.6% |
| Panamanians | 1.9 /100 | #225 | Tragic 5.6% |
| Immigrants | Cambodia | 1.8 /100 | #226 | Tragic 5.6% |
| Immigrants | Panama | 1.8 /100 | #227 | Tragic 5.6% |
| Seminole | 1.8 /100 | #228 | Tragic 5.6% |
| Central Americans | 1.8 /100 | #229 | Tragic 5.6% |
| Immigrants | Africa | 1.7 /100 | #230 | Tragic 5.6% |
| Choctaw | 1.6 /100 | #231 | Tragic 5.6% |
| Moroccans | 1.6 /100 | #232 | Tragic 5.6% |
| Somalis | 1.5 /100 | #233 | Tragic 5.6% |
| Immigrants | Somalia | 1.5 /100 | #234 | Tragic 5.6% |
| Immigrants | Honduras | 1.5 /100 | #235 | Tragic 5.6% |