Palestinian vs Uruguayan Male Unemployment
COMPARE
Palestinian
Uruguayan
Male Unemployment
Male Unemployment Comparison
Palestinians
Uruguayans
5.1%
MALE UNEMPLOYMENT
87.7/ 100
METRIC RATING
123rd/ 347
METRIC RANK
5.1%
MALE UNEMPLOYMENT
93.0/ 100
METRIC RATING
99th/ 347
METRIC RANK
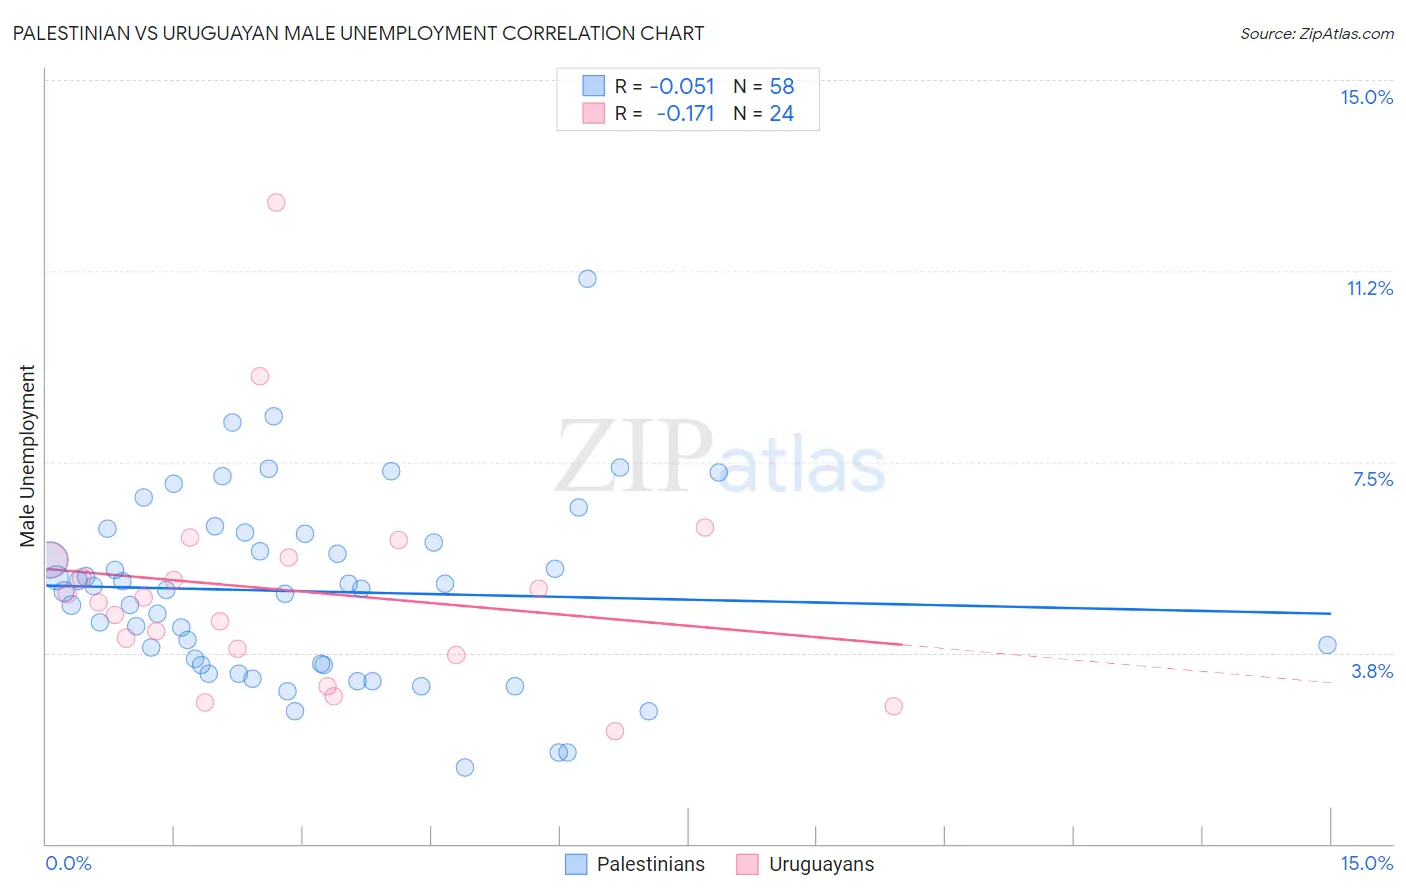
Palestinian vs Uruguayan Male Unemployment Correlation Chart
The statistical analysis conducted on geographies consisting of 216,271,128 people shows a slight negative correlation between the proportion of Palestinians and unemployment rate among males in the United States with a correlation coefficient (R) of -0.051 and weighted average of 5.1%. Similarly, the statistical analysis conducted on geographies consisting of 144,681,334 people shows a poor negative correlation between the proportion of Uruguayans and unemployment rate among males in the United States with a correlation coefficient (R) of -0.171 and weighted average of 5.1%, a difference of 0.94%.
Male Unemployment Correlation Summary
| Measurement | Palestinian | Uruguayan |
| Minimum | 1.5% | 2.2% |
| Maximum | 11.1% | 12.6% |
| Range | 9.6% | 10.4% |
| Mean | 5.0% | 5.0% |
| Median | 5.0% | 4.8% |
| Interquartile 25% (IQ1) | 3.5% | 3.8% |
| Interquartile 75% (IQ3) | 6.1% | 5.6% |
| Interquartile Range (IQR) | 2.6% | 1.8% |
| Standard Deviation (Sample) | 1.8% | 2.2% |
| Standard Deviation (Population) | 1.8% | 2.2% |
Similar Demographics by Male Unemployment
Demographics Similar to Palestinians by Male Unemployment
In terms of male unemployment, the demographic groups most similar to Palestinians are Immigrants from Latvia (5.1%, a difference of 0.030%), Nicaraguan (5.1%, a difference of 0.070%), Immigrants from Lithuania (5.1%, a difference of 0.070%), Mongolian (5.1%, a difference of 0.10%), and Ukrainian (5.1%, a difference of 0.11%).
| Demographics | Rating | Rank | Male Unemployment |
| Immigrants | Denmark | 89.4 /100 | #116 | Excellent 5.1% |
| Estonians | 89.0 /100 | #117 | Excellent 5.1% |
| Cypriots | 88.8 /100 | #118 | Excellent 5.1% |
| French Canadians | 88.6 /100 | #119 | Excellent 5.1% |
| Ukrainians | 88.4 /100 | #120 | Excellent 5.1% |
| Mongolians | 88.4 /100 | #121 | Excellent 5.1% |
| Nicaraguans | 88.2 /100 | #122 | Excellent 5.1% |
| Palestinians | 87.7 /100 | #123 | Excellent 5.1% |
| Immigrants | Latvia | 87.5 /100 | #124 | Excellent 5.1% |
| Immigrants | Lithuania | 87.2 /100 | #125 | Excellent 5.1% |
| Immigrants | Colombia | 86.8 /100 | #126 | Excellent 5.1% |
| Immigrants | Brazil | 86.3 /100 | #127 | Excellent 5.2% |
| Hungarians | 85.1 /100 | #128 | Excellent 5.2% |
| Immigrants | Western Europe | 84.8 /100 | #129 | Excellent 5.2% |
| Immigrants | Malaysia | 83.5 /100 | #130 | Excellent 5.2% |
Demographics Similar to Uruguayans by Male Unemployment
In terms of male unemployment, the demographic groups most similar to Uruguayans are Russian (5.1%, a difference of 0.020%), German Russian (5.1%, a difference of 0.060%), Immigrants from Kuwait (5.1%, a difference of 0.070%), Immigrants from France (5.1%, a difference of 0.070%), and Immigrants from Spain (5.1%, a difference of 0.10%).
| Demographics | Rating | Rank | Male Unemployment |
| Slavs | 94.2 /100 | #92 | Exceptional 5.1% |
| Immigrants | Serbia | 94.2 /100 | #93 | Exceptional 5.1% |
| Canadians | 94.1 /100 | #94 | Exceptional 5.1% |
| Italians | 93.8 /100 | #95 | Exceptional 5.1% |
| Asians | 93.7 /100 | #96 | Exceptional 5.1% |
| Immigrants | Spain | 93.4 /100 | #97 | Exceptional 5.1% |
| Immigrants | Kuwait | 93.3 /100 | #98 | Exceptional 5.1% |
| Uruguayans | 93.0 /100 | #99 | Exceptional 5.1% |
| Russians | 92.9 /100 | #100 | Exceptional 5.1% |
| German Russians | 92.7 /100 | #101 | Exceptional 5.1% |
| Immigrants | France | 92.7 /100 | #102 | Exceptional 5.1% |
| Immigrants | Jordan | 91.9 /100 | #103 | Exceptional 5.1% |
| Immigrants | Chile | 91.8 /100 | #104 | Exceptional 5.1% |
| Immigrants | Czechoslovakia | 91.7 /100 | #105 | Exceptional 5.1% |
| Immigrants | Ethiopia | 91.5 /100 | #106 | Exceptional 5.1% |