Palestinian vs Immigrants from Eastern Europe Female Unemployment
COMPARE
Palestinian
Immigrants from Eastern Europe
Female Unemployment
Female Unemployment Comparison
Palestinians
Immigrants from Eastern Europe
5.1%
FEMALE UNEMPLOYMENT
80.8/ 100
METRIC RATING
142nd/ 347
METRIC RANK
5.1%
FEMALE UNEMPLOYMENT
81.5/ 100
METRIC RATING
141st/ 347
METRIC RANK
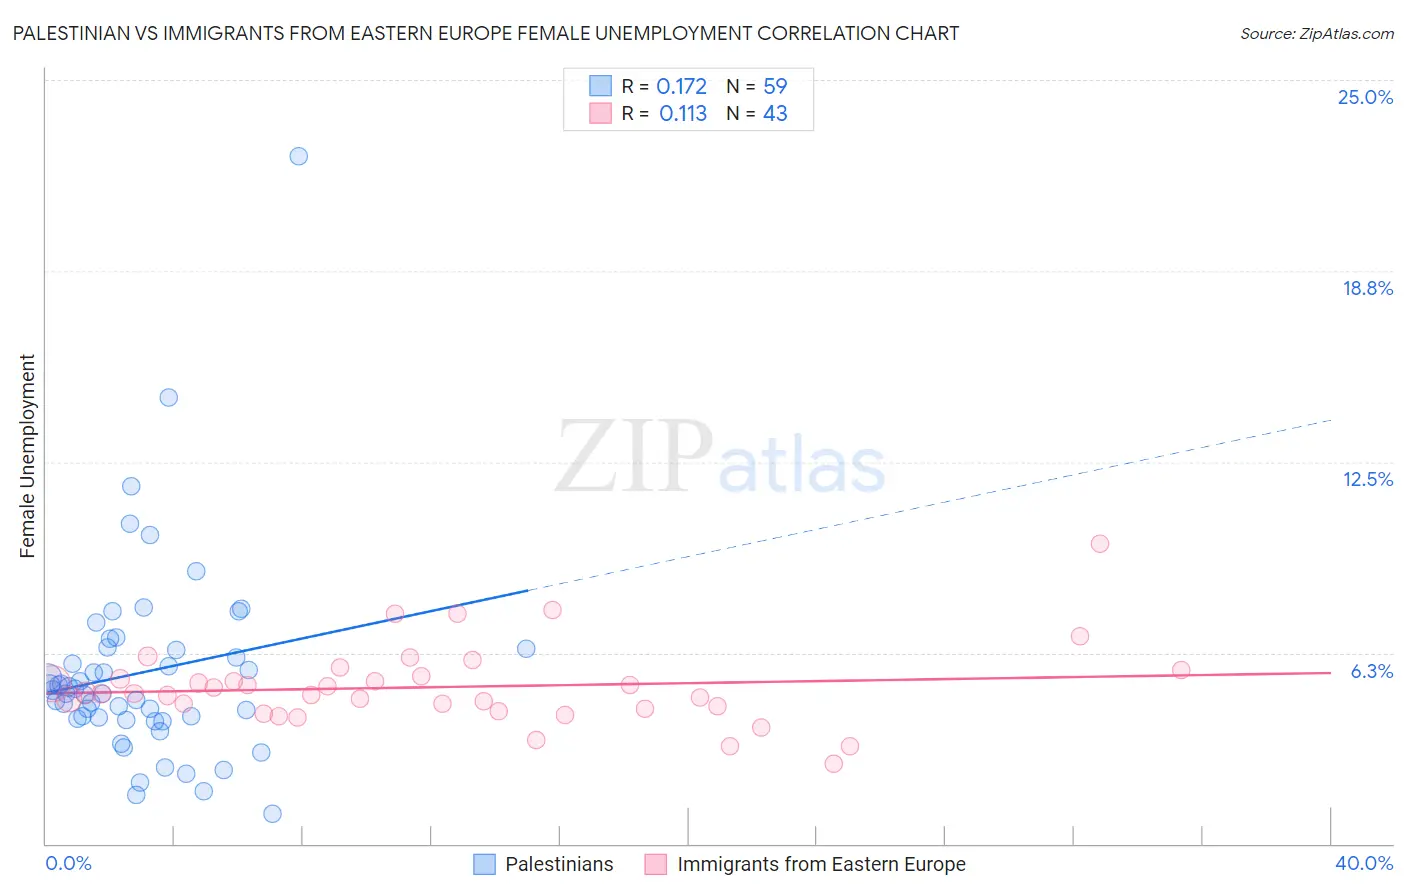
Palestinian vs Immigrants from Eastern Europe Female Unemployment Correlation Chart
The statistical analysis conducted on geographies consisting of 216,232,493 people shows a poor positive correlation between the proportion of Palestinians and unemploymnet rate among females in the United States with a correlation coefficient (R) of 0.172 and weighted average of 5.1%. Similarly, the statistical analysis conducted on geographies consisting of 471,678,219 people shows a poor positive correlation between the proportion of Immigrants from Eastern Europe and unemploymnet rate among females in the United States with a correlation coefficient (R) of 0.113 and weighted average of 5.1%, a difference of 0.080%.
Female Unemployment Correlation Summary
| Measurement | Palestinian | Immigrants from Eastern Europe |
| Minimum | 1.0% | 2.6% |
| Maximum | 22.5% | 9.8% |
| Range | 21.5% | 7.2% |
| Mean | 5.6% | 5.1% |
| Median | 5.0% | 4.9% |
| Interquartile 25% (IQ1) | 4.1% | 4.4% |
| Interquartile 75% (IQ3) | 6.4% | 5.5% |
| Interquartile Range (IQR) | 2.3% | 1.1% |
| Standard Deviation (Sample) | 3.3% | 1.3% |
| Standard Deviation (Population) | 3.3% | 1.3% |
Demographics Similar to Palestinians and Immigrants from Eastern Europe by Female Unemployment
In terms of female unemployment, the demographic groups most similar to Palestinians are Immigrants from Kazakhstan (5.1%, a difference of 0.010%), Immigrants from Jordan (5.1%, a difference of 0.040%), Immigrants from Oceania (5.2%, a difference of 0.12%), Immigrants from Norway (5.2%, a difference of 0.13%), and Argentinean (5.2%, a difference of 0.15%). Similarly, the demographic groups most similar to Immigrants from Eastern Europe are Immigrants from Kazakhstan (5.1%, a difference of 0.090%), Immigrants from Jordan (5.1%, a difference of 0.11%), Immigrants from France (5.1%, a difference of 0.12%), Immigrants from Eastern Asia (5.1%, a difference of 0.16%), and Chickasaw (5.1%, a difference of 0.18%).
| Demographics | Rating | Rank | Female Unemployment |
| Immigrants | Ethiopia | 85.4 /100 | #131 | Excellent 5.1% |
| Immigrants | Sri Lanka | 85.0 /100 | #132 | Excellent 5.1% |
| Immigrants | Hong Kong | 84.8 /100 | #133 | Excellent 5.1% |
| Immigrants | Eritrea | 84.6 /100 | #134 | Excellent 5.1% |
| Immigrants | Latvia | 84.6 /100 | #135 | Excellent 5.1% |
| Indians (Asian) | 84.2 /100 | #136 | Excellent 5.1% |
| Pakistanis | 83.8 /100 | #137 | Excellent 5.1% |
| Chickasaw | 83.2 /100 | #138 | Excellent 5.1% |
| Immigrants | Eastern Asia | 83.0 /100 | #139 | Excellent 5.1% |
| Immigrants | France | 82.7 /100 | #140 | Excellent 5.1% |
| Immigrants | Eastern Europe | 81.5 /100 | #141 | Excellent 5.1% |
| Palestinians | 80.8 /100 | #142 | Excellent 5.1% |
| Immigrants | Kazakhstan | 80.7 /100 | #143 | Excellent 5.1% |
| Immigrants | Jordan | 80.4 /100 | #144 | Excellent 5.1% |
| Immigrants | Oceania | 79.5 /100 | #145 | Good 5.2% |
| Immigrants | Norway | 79.4 /100 | #146 | Good 5.2% |
| Argentineans | 79.2 /100 | #147 | Good 5.2% |
| Immigrants | Argentina | 78.7 /100 | #148 | Good 5.2% |
| Asians | 78.3 /100 | #149 | Good 5.2% |
| Egyptians | 78.3 /100 | #150 | Good 5.2% |
| Immigrants | China | 75.9 /100 | #151 | Good 5.2% |