Palestinian vs Immigrants from Eastern Europe 7th Grade
COMPARE
Palestinian
Immigrants from Eastern Europe
7th Grade
7th Grade Comparison
Palestinians
Immigrants from Eastern Europe
96.4%
7TH GRADE
93.5/ 100
METRIC RATING
126th/ 347
METRIC RANK
96.3%
7TH GRADE
83.7/ 100
METRIC RATING
146th/ 347
METRIC RANK
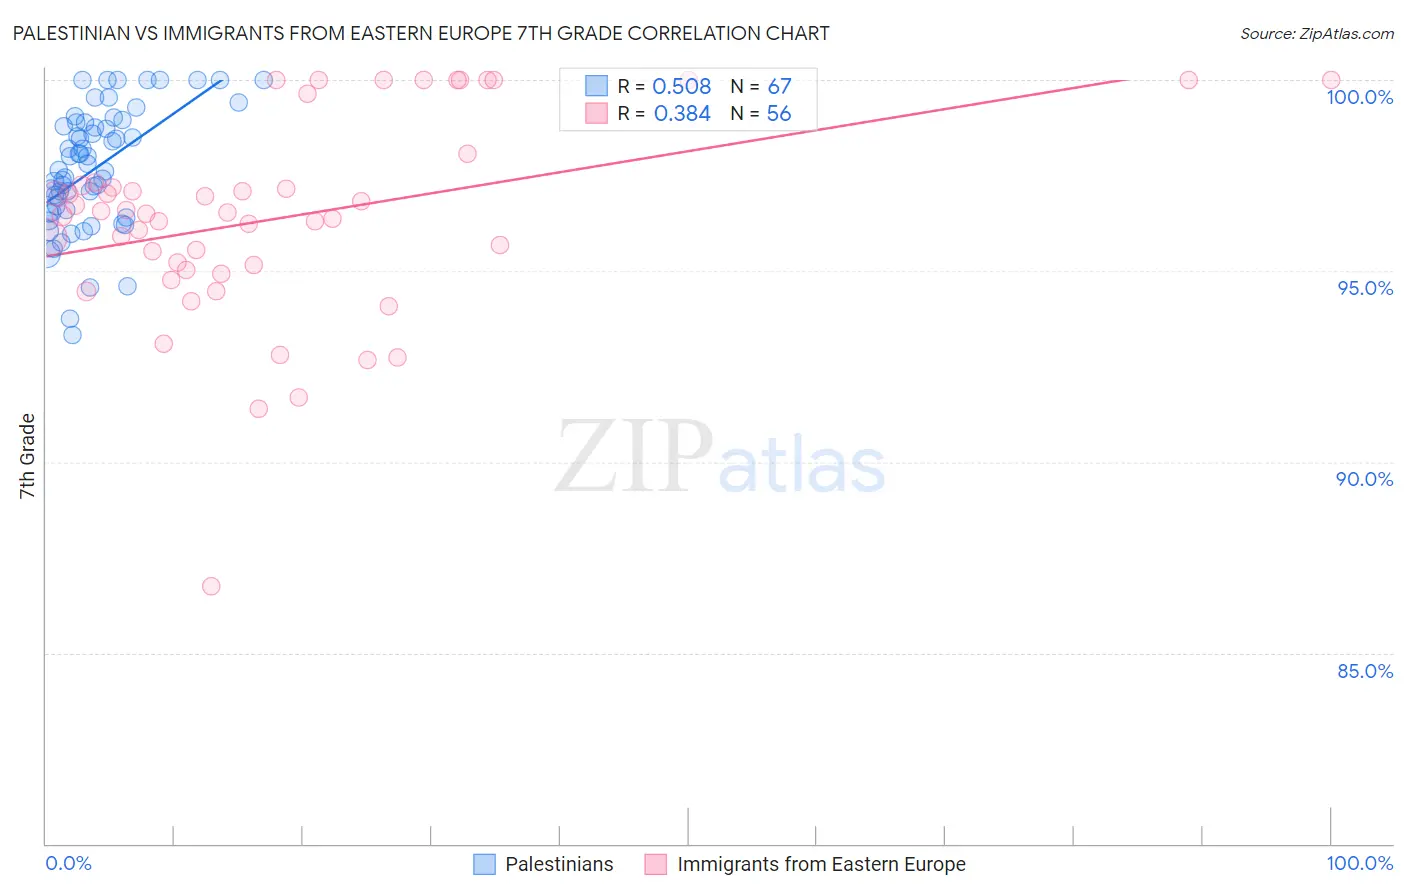
Palestinian vs Immigrants from Eastern Europe 7th Grade Correlation Chart
The statistical analysis conducted on geographies consisting of 216,424,519 people shows a substantial positive correlation between the proportion of Palestinians and percentage of population with at least 7th grade education in the United States with a correlation coefficient (R) of 0.508 and weighted average of 96.4%. Similarly, the statistical analysis conducted on geographies consisting of 475,879,420 people shows a mild positive correlation between the proportion of Immigrants from Eastern Europe and percentage of population with at least 7th grade education in the United States with a correlation coefficient (R) of 0.384 and weighted average of 96.3%, a difference of 0.16%.
7th Grade Correlation Summary
| Measurement | Palestinian | Immigrants from Eastern Europe |
| Minimum | 93.3% | 86.7% |
| Maximum | 100.0% | 100.0% |
| Range | 6.7% | 13.3% |
| Mean | 97.7% | 96.4% |
| Median | 97.6% | 96.5% |
| Interquartile 25% (IQ1) | 96.5% | 95.1% |
| Interquartile 75% (IQ3) | 98.9% | 97.3% |
| Interquartile Range (IQR) | 2.4% | 2.2% |
| Standard Deviation (Sample) | 1.6% | 2.6% |
| Standard Deviation (Population) | 1.6% | 2.6% |
Demographics Similar to Palestinians and Immigrants from Eastern Europe by 7th Grade
In terms of 7th grade, the demographic groups most similar to Palestinians are Immigrants from Bosnia and Herzegovina (96.4%, a difference of 0.0%), Immigrants from Romania (96.4%, a difference of 0.010%), Immigrants from North Macedonia (96.4%, a difference of 0.010%), Immigrants from Serbia (96.4%, a difference of 0.020%), and Filipino (96.4%, a difference of 0.030%). Similarly, the demographic groups most similar to Immigrants from Eastern Europe are Blackfeet (96.3%, a difference of 0.0%), Spanish (96.3%, a difference of 0.030%), Immigrants from Greece (96.3%, a difference of 0.030%), Immigrants from South Central Asia (96.3%, a difference of 0.040%), and Burmese (96.3%, a difference of 0.040%).
| Demographics | Rating | Rank | 7th Grade |
| Palestinians | 93.5 /100 | #126 | Exceptional 96.4% |
| Immigrants | Bosnia and Herzegovina | 93.3 /100 | #127 | Exceptional 96.4% |
| Immigrants | Romania | 93.2 /100 | #128 | Exceptional 96.4% |
| Immigrants | North Macedonia | 93.1 /100 | #129 | Exceptional 96.4% |
| Immigrants | Serbia | 92.8 /100 | #130 | Exceptional 96.4% |
| Filipinos | 92.1 /100 | #131 | Exceptional 96.4% |
| Colville | 91.7 /100 | #132 | Exceptional 96.4% |
| Hmong | 91.5 /100 | #133 | Exceptional 96.4% |
| Soviet Union | 91.2 /100 | #134 | Exceptional 96.4% |
| Immigrants | Kuwait | 91.1 /100 | #135 | Exceptional 96.4% |
| Immigrants | Hungary | 90.6 /100 | #136 | Exceptional 96.4% |
| Immigrants | Turkey | 90.2 /100 | #137 | Exceptional 96.4% |
| Jordanians | 90.0 /100 | #138 | Excellent 96.4% |
| Basques | 89.3 /100 | #139 | Excellent 96.4% |
| Cambodians | 88.3 /100 | #140 | Excellent 96.3% |
| Immigrants | South Central Asia | 87.1 /100 | #141 | Excellent 96.3% |
| Burmese | 87.1 /100 | #142 | Excellent 96.3% |
| Spanish | 86.6 /100 | #143 | Excellent 96.3% |
| Immigrants | Greece | 85.9 /100 | #144 | Excellent 96.3% |
| Blackfeet | 83.9 /100 | #145 | Excellent 96.3% |
| Immigrants | Eastern Europe | 83.7 /100 | #146 | Excellent 96.3% |