Palestinian vs Immigrants from Eastern Europe Average Family Size
COMPARE
Palestinian
Immigrants from Eastern Europe
Average Family Size
Average Family Size Comparison
Palestinians
Immigrants from Eastern Europe
3.23
AVERAGE FAMILY SIZE
46.6/ 100
METRIC RATING
180th/ 347
METRIC RANK
3.17
AVERAGE FAMILY SIZE
2.1/ 100
METRIC RATING
249th/ 347
METRIC RANK
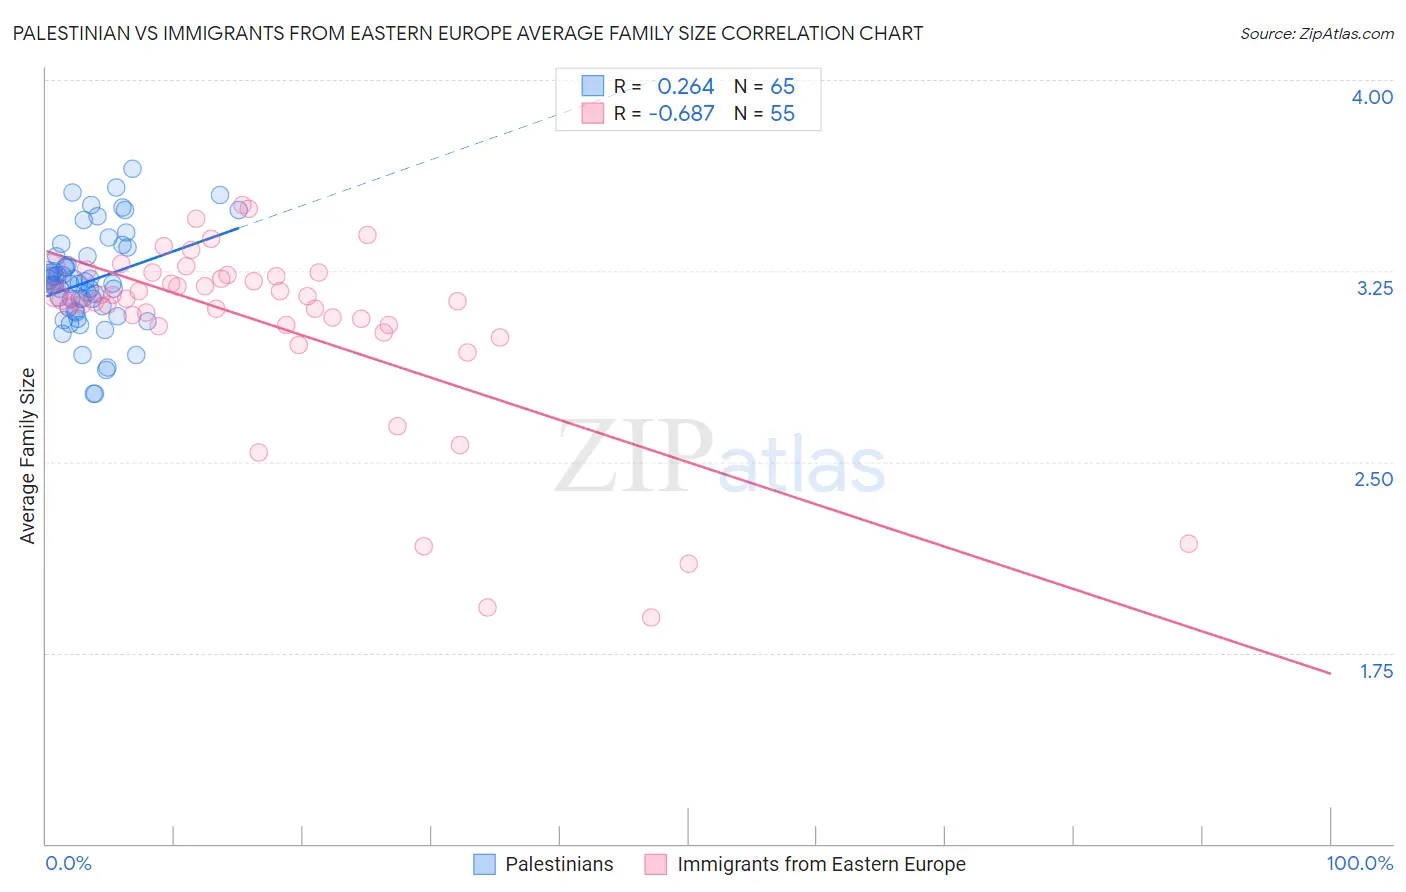
Palestinian vs Immigrants from Eastern Europe Average Family Size Correlation Chart
The statistical analysis conducted on geographies consisting of 216,402,658 people shows a weak positive correlation between the proportion of Palestinians and average family size in the United States with a correlation coefficient (R) of 0.264 and weighted average of 3.23. Similarly, the statistical analysis conducted on geographies consisting of 475,514,082 people shows a significant negative correlation between the proportion of Immigrants from Eastern Europe and average family size in the United States with a correlation coefficient (R) of -0.687 and weighted average of 3.17, a difference of 1.7%.
Average Family Size Correlation Summary
| Measurement | Palestinian | Immigrants from Eastern Europe |
| Minimum | 2.77 | 1.89 |
| Maximum | 3.65 | 3.51 |
| Range | 0.88 | 1.62 |
| Mean | 3.21 | 3.04 |
| Median | 3.20 | 3.14 |
| Interquartile 25% (IQ1) | 3.10 | 3.04 |
| Interquartile 75% (IQ3) | 3.31 | 3.23 |
| Interquartile Range (IQR) | 0.21 | 0.19 |
| Standard Deviation (Sample) | 0.19 | 0.37 |
| Standard Deviation (Population) | 0.19 | 0.36 |
Similar Demographics by Average Family Size
Demographics Similar to Palestinians by Average Family Size
In terms of average family size, the demographic groups most similar to Palestinians are Argentinean (3.23, a difference of 0.010%), Spaniard (3.23, a difference of 0.010%), Immigrants from Korea (3.23, a difference of 0.010%), Spanish (3.23, a difference of 0.030%), and Israeli (3.23, a difference of 0.040%).
| Demographics | Rating | Rank | Average Family Size |
| Immigrants | Uruguay | 52.0 /100 | #173 | Average 3.23 |
| Immigrants | South Central Asia | 50.0 /100 | #174 | Average 3.23 |
| Immigrants | China | 49.9 /100 | #175 | Average 3.23 |
| Israelis | 48.7 /100 | #176 | Average 3.23 |
| Argentineans | 47.4 /100 | #177 | Average 3.23 |
| Spaniards | 47.2 /100 | #178 | Average 3.23 |
| Immigrants | Korea | 46.9 /100 | #179 | Average 3.23 |
| Palestinians | 46.6 /100 | #180 | Average 3.23 |
| Spanish | 44.8 /100 | #181 | Average 3.23 |
| Moroccans | 44.2 /100 | #182 | Average 3.22 |
| Immigrants | Northern Africa | 41.7 /100 | #183 | Average 3.22 |
| Immigrants | Eastern Asia | 40.8 /100 | #184 | Average 3.22 |
| Immigrants | Sri Lanka | 39.8 /100 | #185 | Fair 3.22 |
| Immigrants | Argentina | 39.8 /100 | #186 | Fair 3.22 |
| Immigrants | Malaysia | 39.0 /100 | #187 | Fair 3.22 |
Demographics Similar to Immigrants from Eastern Europe by Average Family Size
In terms of average family size, the demographic groups most similar to Immigrants from Eastern Europe are Immigrants from Belarus (3.17, a difference of 0.040%), Puget Sound Salish (3.17, a difference of 0.060%), Cajun (3.17, a difference of 0.070%), Immigrants from Spain (3.17, a difference of 0.070%), and Danish (3.17, a difference of 0.080%).
| Demographics | Rating | Rank | Average Family Size |
| Hungarians | 3.0 /100 | #242 | Tragic 3.18 |
| Immigrants | Moldova | 2.9 /100 | #243 | Tragic 3.18 |
| Immigrants | Southern Europe | 2.9 /100 | #244 | Tragic 3.18 |
| Immigrants | Brazil | 2.7 /100 | #245 | Tragic 3.18 |
| Danes | 2.5 /100 | #246 | Tragic 3.17 |
| Cajuns | 2.4 /100 | #247 | Tragic 3.17 |
| Immigrants | Belarus | 2.3 /100 | #248 | Tragic 3.17 |
| Immigrants | Eastern Europe | 2.1 /100 | #249 | Tragic 3.17 |
| Puget Sound Salish | 1.9 /100 | #250 | Tragic 3.17 |
| Immigrants | Spain | 1.8 /100 | #251 | Tragic 3.17 |
| Immigrants | Saudi Arabia | 1.7 /100 | #252 | Tragic 3.17 |
| South Africans | 1.7 /100 | #253 | Tragic 3.17 |
| Immigrants | Hungary | 1.7 /100 | #254 | Tragic 3.17 |
| Cape Verdeans | 1.6 /100 | #255 | Tragic 3.17 |
| Immigrants | Kazakhstan | 1.5 /100 | #256 | Tragic 3.17 |