Palestinian vs Dominican Female Unemployment
COMPARE
Palestinian
Dominican
Female Unemployment
Female Unemployment Comparison
Palestinians
Dominicans
5.1%
FEMALE UNEMPLOYMENT
80.8/ 100
METRIC RATING
142nd/ 347
METRIC RANK
7.2%
FEMALE UNEMPLOYMENT
0.0/ 100
METRIC RATING
335th/ 347
METRIC RANK
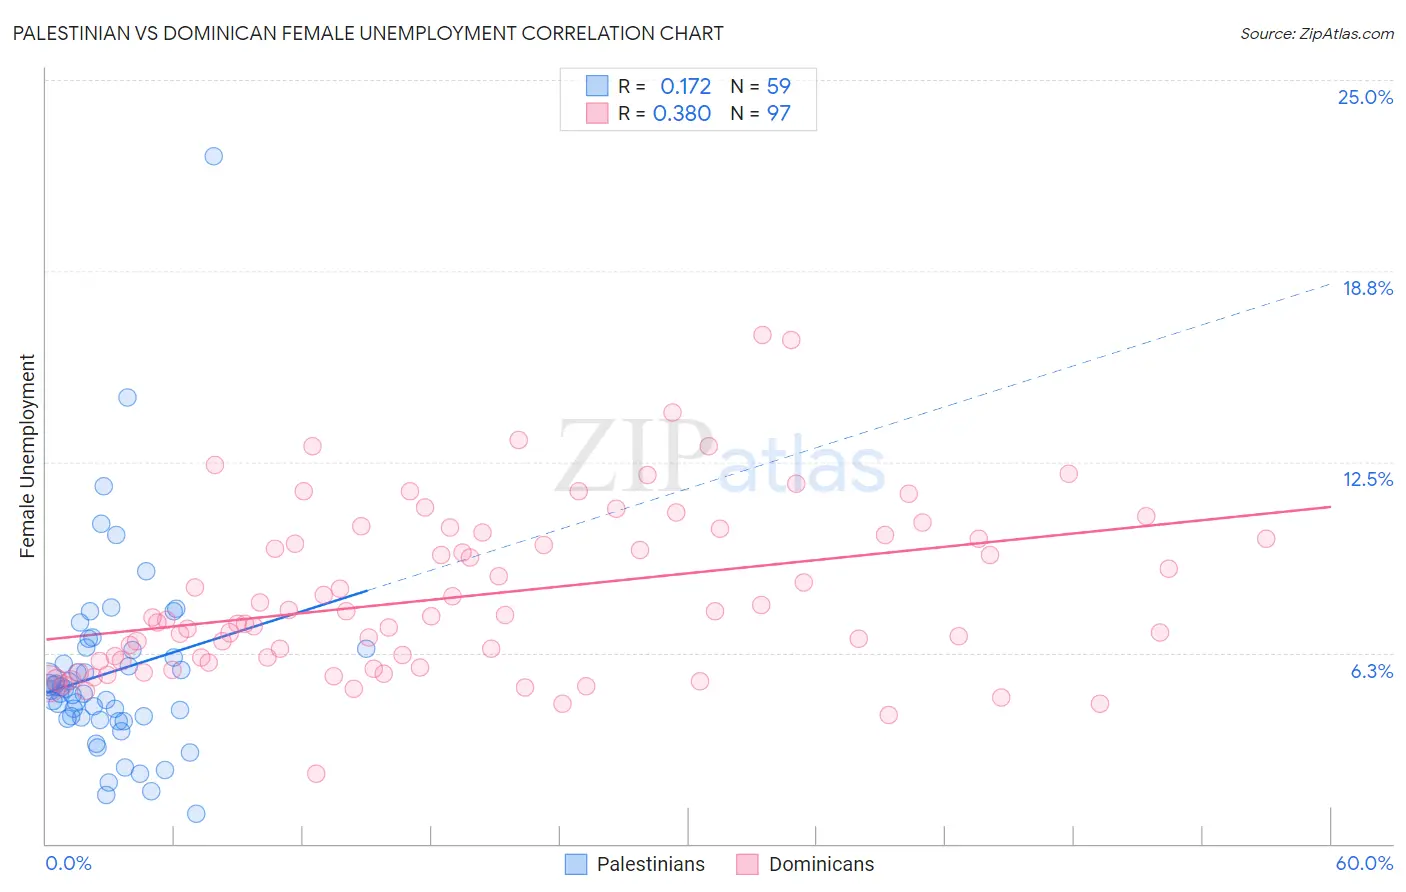
Palestinian vs Dominican Female Unemployment Correlation Chart
The statistical analysis conducted on geographies consisting of 216,232,493 people shows a poor positive correlation between the proportion of Palestinians and unemploymnet rate among females in the United States with a correlation coefficient (R) of 0.172 and weighted average of 5.1%. Similarly, the statistical analysis conducted on geographies consisting of 353,758,930 people shows a mild positive correlation between the proportion of Dominicans and unemploymnet rate among females in the United States with a correlation coefficient (R) of 0.380 and weighted average of 7.2%, a difference of 39.5%.
Female Unemployment Correlation Summary
| Measurement | Palestinian | Dominican |
| Minimum | 1.0% | 2.3% |
| Maximum | 22.5% | 16.7% |
| Range | 21.5% | 14.4% |
| Mean | 5.6% | 8.1% |
| Median | 5.0% | 7.4% |
| Interquartile 25% (IQ1) | 4.1% | 6.0% |
| Interquartile 75% (IQ3) | 6.4% | 10.1% |
| Interquartile Range (IQR) | 2.3% | 4.1% |
| Standard Deviation (Sample) | 3.3% | 2.8% |
| Standard Deviation (Population) | 3.3% | 2.7% |
Similar Demographics by Female Unemployment
Demographics Similar to Palestinians by Female Unemployment
In terms of female unemployment, the demographic groups most similar to Palestinians are Immigrants from Kazakhstan (5.1%, a difference of 0.010%), Immigrants from Jordan (5.1%, a difference of 0.040%), Immigrants from Eastern Europe (5.1%, a difference of 0.080%), Immigrants from Oceania (5.2%, a difference of 0.12%), and Immigrants from Norway (5.2%, a difference of 0.13%).
| Demographics | Rating | Rank | Female Unemployment |
| Immigrants | Latvia | 84.6 /100 | #135 | Excellent 5.1% |
| Indians (Asian) | 84.2 /100 | #136 | Excellent 5.1% |
| Pakistanis | 83.8 /100 | #137 | Excellent 5.1% |
| Chickasaw | 83.2 /100 | #138 | Excellent 5.1% |
| Immigrants | Eastern Asia | 83.0 /100 | #139 | Excellent 5.1% |
| Immigrants | France | 82.7 /100 | #140 | Excellent 5.1% |
| Immigrants | Eastern Europe | 81.5 /100 | #141 | Excellent 5.1% |
| Palestinians | 80.8 /100 | #142 | Excellent 5.1% |
| Immigrants | Kazakhstan | 80.7 /100 | #143 | Excellent 5.1% |
| Immigrants | Jordan | 80.4 /100 | #144 | Excellent 5.1% |
| Immigrants | Oceania | 79.5 /100 | #145 | Good 5.2% |
| Immigrants | Norway | 79.4 /100 | #146 | Good 5.2% |
| Argentineans | 79.2 /100 | #147 | Good 5.2% |
| Immigrants | Argentina | 78.7 /100 | #148 | Good 5.2% |
| Asians | 78.3 /100 | #149 | Good 5.2% |
Demographics Similar to Dominicans by Female Unemployment
In terms of female unemployment, the demographic groups most similar to Dominicans are Immigrants from Dominican Republic (7.2%, a difference of 0.64%), Immigrants from Armenia (7.1%, a difference of 1.4%), Navajo (7.3%, a difference of 1.6%), Menominee (7.0%, a difference of 1.8%), and Sioux (7.0%, a difference of 1.8%).
| Demographics | Rating | Rank | Female Unemployment |
| Guyanese | 0.0 /100 | #328 | Tragic 6.7% |
| Immigrants | Guyana | 0.0 /100 | #329 | Tragic 6.7% |
| Yakama | 0.0 /100 | #330 | Tragic 6.7% |
| Paiute | 0.0 /100 | #331 | Tragic 6.8% |
| Sioux | 0.0 /100 | #332 | Tragic 7.0% |
| Menominee | 0.0 /100 | #333 | Tragic 7.0% |
| Immigrants | Armenia | 0.0 /100 | #334 | Tragic 7.1% |
| Dominicans | 0.0 /100 | #335 | Tragic 7.2% |
| Immigrants | Dominican Republic | 0.0 /100 | #336 | Tragic 7.2% |
| Navajo | 0.0 /100 | #337 | Tragic 7.3% |
| Tohono O'odham | 0.0 /100 | #338 | Tragic 7.7% |
| Immigrants | Yemen | 0.0 /100 | #339 | Tragic 7.8% |
| Hopi | 0.0 /100 | #340 | Tragic 8.1% |
| Inupiat | 0.0 /100 | #341 | Tragic 8.2% |
| Puerto Ricans | 0.0 /100 | #342 | Tragic 8.3% |