Bangladeshi vs Immigrants from Eastern Europe Female Unemployment
COMPARE
Bangladeshi
Immigrants from Eastern Europe
Female Unemployment
Female Unemployment Comparison
Bangladeshis
Immigrants from Eastern Europe
5.2%
FEMALE UNEMPLOYMENT
64.3/ 100
METRIC RATING
164th/ 347
METRIC RANK
5.1%
FEMALE UNEMPLOYMENT
81.5/ 100
METRIC RATING
141st/ 347
METRIC RANK
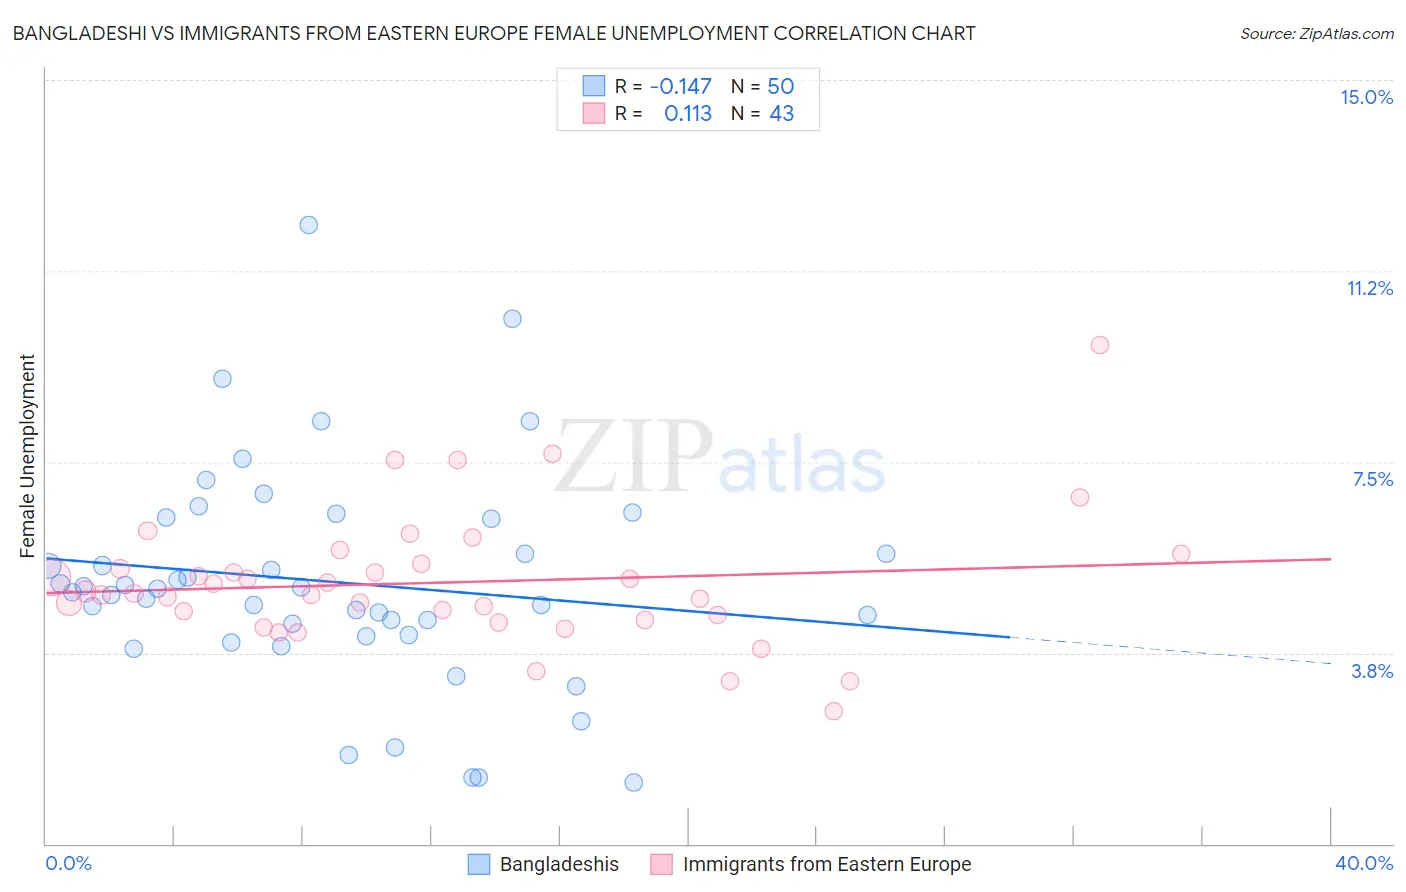
Bangladeshi vs Immigrants from Eastern Europe Female Unemployment Correlation Chart
The statistical analysis conducted on geographies consisting of 141,088,133 people shows a poor negative correlation between the proportion of Bangladeshis and unemploymnet rate among females in the United States with a correlation coefficient (R) of -0.147 and weighted average of 5.2%. Similarly, the statistical analysis conducted on geographies consisting of 471,678,219 people shows a poor positive correlation between the proportion of Immigrants from Eastern Europe and unemploymnet rate among females in the United States with a correlation coefficient (R) of 0.113 and weighted average of 5.1%, a difference of 1.4%.
Female Unemployment Correlation Summary
| Measurement | Bangladeshi | Immigrants from Eastern Europe |
| Minimum | 1.2% | 2.6% |
| Maximum | 12.1% | 9.8% |
| Range | 10.9% | 7.2% |
| Mean | 5.1% | 5.1% |
| Median | 5.0% | 4.9% |
| Interquartile 25% (IQ1) | 4.1% | 4.4% |
| Interquartile 75% (IQ3) | 6.4% | 5.5% |
| Interquartile Range (IQR) | 2.3% | 1.1% |
| Standard Deviation (Sample) | 2.2% | 1.3% |
| Standard Deviation (Population) | 2.1% | 1.3% |
Similar Demographics by Female Unemployment
Demographics Similar to Bangladeshis by Female Unemployment
In terms of female unemployment, the demographic groups most similar to Bangladeshis are Immigrants from Asia (5.2%, a difference of 0.0%), Syrian (5.2%, a difference of 0.10%), Native Hawaiian (5.2%, a difference of 0.10%), Potawatomi (5.2%, a difference of 0.11%), and Immigrants from Thailand (5.2%, a difference of 0.14%).
| Demographics | Rating | Rank | Female Unemployment |
| Immigrants | Russia | 69.3 /100 | #157 | Good 5.2% |
| Albanians | 68.3 /100 | #158 | Good 5.2% |
| Immigrants | Micronesia | 66.9 /100 | #159 | Good 5.2% |
| Immigrants | Spain | 66.8 /100 | #160 | Good 5.2% |
| Immigrants | Pakistan | 66.7 /100 | #161 | Good 5.2% |
| Potawatomi | 65.9 /100 | #162 | Good 5.2% |
| Immigrants | Asia | 64.3 /100 | #163 | Good 5.2% |
| Bangladeshis | 64.3 /100 | #164 | Good 5.2% |
| Syrians | 62.8 /100 | #165 | Good 5.2% |
| Native Hawaiians | 62.7 /100 | #166 | Good 5.2% |
| Immigrants | Thailand | 62.1 /100 | #167 | Good 5.2% |
| Sri Lankans | 59.4 /100 | #168 | Average 5.2% |
| Immigrants | Chile | 59.0 /100 | #169 | Average 5.2% |
| Spanish | 55.9 /100 | #170 | Average 5.2% |
| Immigrants | Denmark | 55.0 /100 | #171 | Average 5.2% |
Demographics Similar to Immigrants from Eastern Europe by Female Unemployment
In terms of female unemployment, the demographic groups most similar to Immigrants from Eastern Europe are Palestinian (5.1%, a difference of 0.080%), Immigrants from Kazakhstan (5.1%, a difference of 0.090%), Immigrants from Jordan (5.1%, a difference of 0.11%), Immigrants from France (5.1%, a difference of 0.12%), and Immigrants from Eastern Asia (5.1%, a difference of 0.16%).
| Demographics | Rating | Rank | Female Unemployment |
| Immigrants | Eritrea | 84.6 /100 | #134 | Excellent 5.1% |
| Immigrants | Latvia | 84.6 /100 | #135 | Excellent 5.1% |
| Indians (Asian) | 84.2 /100 | #136 | Excellent 5.1% |
| Pakistanis | 83.8 /100 | #137 | Excellent 5.1% |
| Chickasaw | 83.2 /100 | #138 | Excellent 5.1% |
| Immigrants | Eastern Asia | 83.0 /100 | #139 | Excellent 5.1% |
| Immigrants | France | 82.7 /100 | #140 | Excellent 5.1% |
| Immigrants | Eastern Europe | 81.5 /100 | #141 | Excellent 5.1% |
| Palestinians | 80.8 /100 | #142 | Excellent 5.1% |
| Immigrants | Kazakhstan | 80.7 /100 | #143 | Excellent 5.1% |
| Immigrants | Jordan | 80.4 /100 | #144 | Excellent 5.1% |
| Immigrants | Oceania | 79.5 /100 | #145 | Good 5.2% |
| Immigrants | Norway | 79.4 /100 | #146 | Good 5.2% |
| Argentineans | 79.2 /100 | #147 | Good 5.2% |
| Immigrants | Argentina | 78.7 /100 | #148 | Good 5.2% |