Palestinian vs Immigrants from Europe Female Unemployment
COMPARE
Palestinian
Immigrants from Europe
Female Unemployment
Female Unemployment Comparison
Palestinians
Immigrants from Europe
5.1%
FEMALE UNEMPLOYMENT
80.8/ 100
METRIC RATING
142nd/ 347
METRIC RANK
5.1%
FEMALE UNEMPLOYMENT
87.2/ 100
METRIC RATING
124th/ 347
METRIC RANK
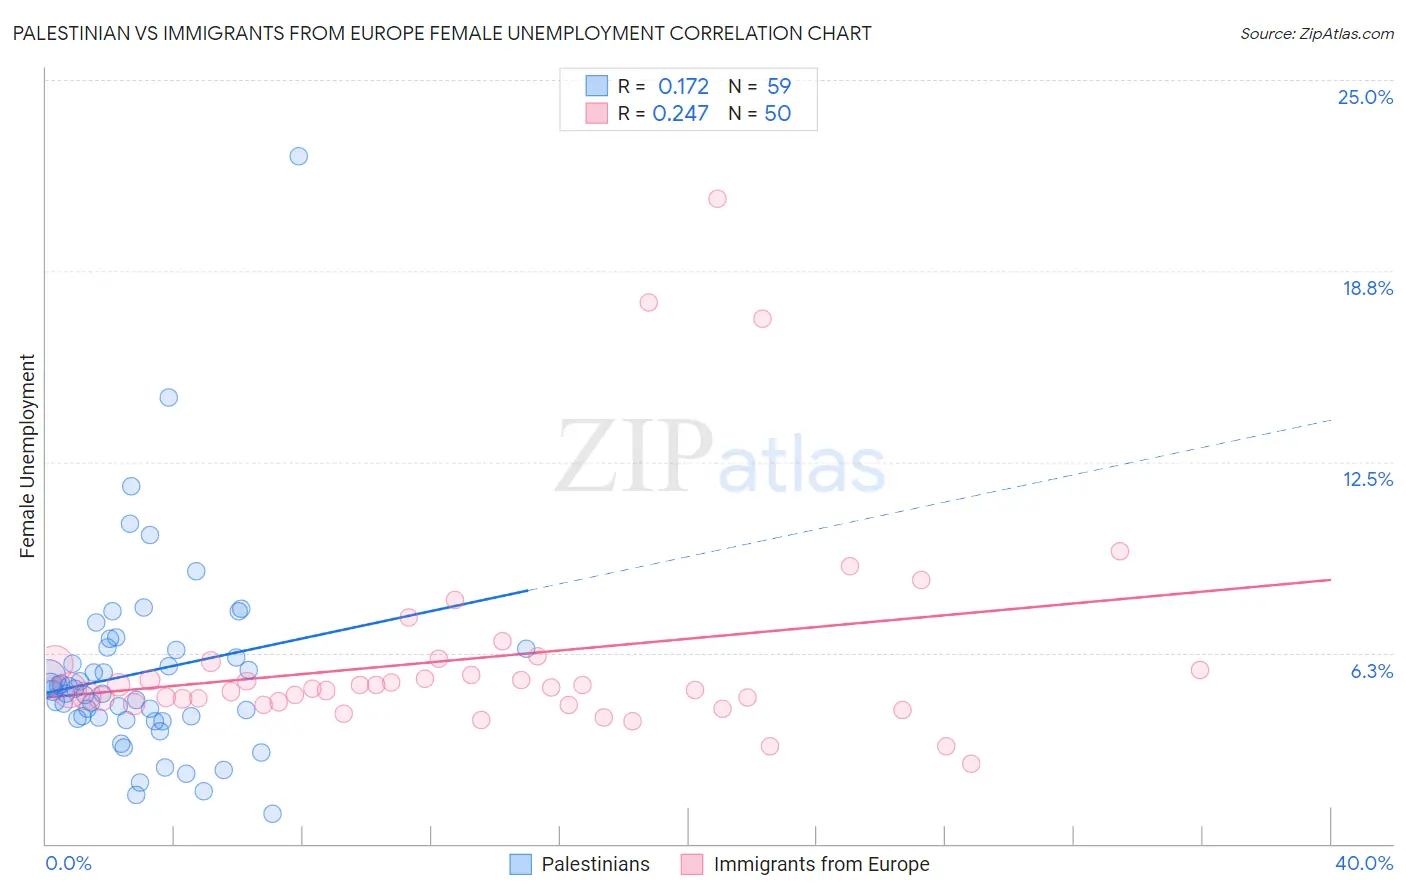
Palestinian vs Immigrants from Europe Female Unemployment Correlation Chart
The statistical analysis conducted on geographies consisting of 216,232,493 people shows a poor positive correlation between the proportion of Palestinians and unemploymnet rate among females in the United States with a correlation coefficient (R) of 0.172 and weighted average of 5.1%. Similarly, the statistical analysis conducted on geographies consisting of 538,568,700 people shows a weak positive correlation between the proportion of Immigrants from Europe and unemploymnet rate among females in the United States with a correlation coefficient (R) of 0.247 and weighted average of 5.1%, a difference of 0.75%.
Female Unemployment Correlation Summary
| Measurement | Palestinian | Immigrants from Europe |
| Minimum | 1.0% | 2.6% |
| Maximum | 22.5% | 21.1% |
| Range | 21.5% | 18.5% |
| Mean | 5.6% | 6.1% |
| Median | 5.0% | 5.1% |
| Interquartile 25% (IQ1) | 4.1% | 4.6% |
| Interquartile 75% (IQ3) | 6.4% | 5.9% |
| Interquartile Range (IQR) | 2.3% | 1.2% |
| Standard Deviation (Sample) | 3.3% | 3.5% |
| Standard Deviation (Population) | 3.3% | 3.5% |
Demographics Similar to Palestinians and Immigrants from Europe by Female Unemployment
In terms of female unemployment, the demographic groups most similar to Palestinians are Immigrants from Kazakhstan (5.1%, a difference of 0.010%), Immigrants from Eastern Europe (5.1%, a difference of 0.080%), Immigrants from France (5.1%, a difference of 0.19%), Immigrants from Eastern Asia (5.1%, a difference of 0.24%), and Chickasaw (5.1%, a difference of 0.26%). Similarly, the demographic groups most similar to Immigrants from Europe are Immigrants from South Africa (5.1%, a difference of 0.050%), Basque (5.1%, a difference of 0.10%), Immigrants from Korea (5.1%, a difference of 0.12%), Immigrants from Hungary (5.1%, a difference of 0.16%), and Chilean (5.1%, a difference of 0.19%).
| Demographics | Rating | Rank | Female Unemployment |
| Immigrants | South Africa | 87.6 /100 | #123 | Excellent 5.1% |
| Immigrants | Europe | 87.2 /100 | #124 | Excellent 5.1% |
| Basques | 86.5 /100 | #125 | Excellent 5.1% |
| Immigrants | Korea | 86.3 /100 | #126 | Excellent 5.1% |
| Immigrants | Hungary | 86.0 /100 | #127 | Excellent 5.1% |
| Chileans | 85.8 /100 | #128 | Excellent 5.1% |
| Ethiopians | 85.7 /100 | #129 | Excellent 5.1% |
| Maltese | 85.5 /100 | #130 | Excellent 5.1% |
| Immigrants | Ethiopia | 85.4 /100 | #131 | Excellent 5.1% |
| Immigrants | Sri Lanka | 85.0 /100 | #132 | Excellent 5.1% |
| Immigrants | Hong Kong | 84.8 /100 | #133 | Excellent 5.1% |
| Immigrants | Eritrea | 84.6 /100 | #134 | Excellent 5.1% |
| Immigrants | Latvia | 84.6 /100 | #135 | Excellent 5.1% |
| Indians (Asian) | 84.2 /100 | #136 | Excellent 5.1% |
| Pakistanis | 83.8 /100 | #137 | Excellent 5.1% |
| Chickasaw | 83.2 /100 | #138 | Excellent 5.1% |
| Immigrants | Eastern Asia | 83.0 /100 | #139 | Excellent 5.1% |
| Immigrants | France | 82.7 /100 | #140 | Excellent 5.1% |
| Immigrants | Eastern Europe | 81.5 /100 | #141 | Excellent 5.1% |
| Palestinians | 80.8 /100 | #142 | Excellent 5.1% |
| Immigrants | Kazakhstan | 80.7 /100 | #143 | Excellent 5.1% |