Palestinian vs Ukrainian Female Unemployment
COMPARE
Palestinian
Ukrainian
Female Unemployment
Female Unemployment Comparison
Palestinians
Ukrainians
5.1%
FEMALE UNEMPLOYMENT
80.8/ 100
METRIC RATING
142nd/ 347
METRIC RANK
5.0%
FEMALE UNEMPLOYMENT
97.1/ 100
METRIC RATING
85th/ 347
METRIC RANK
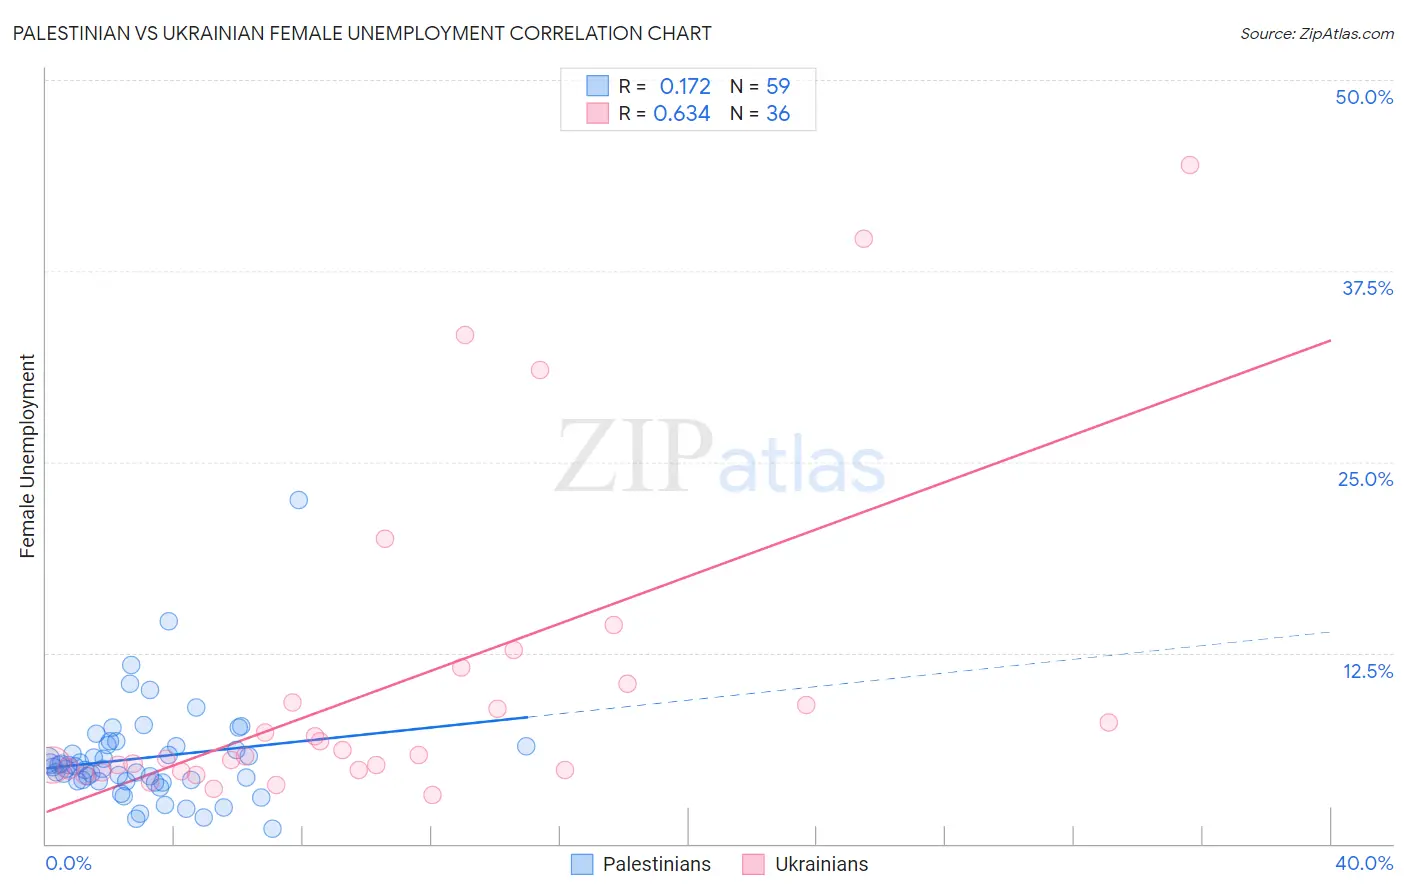
Palestinian vs Ukrainian Female Unemployment Correlation Chart
The statistical analysis conducted on geographies consisting of 216,232,493 people shows a poor positive correlation between the proportion of Palestinians and unemploymnet rate among females in the United States with a correlation coefficient (R) of 0.172 and weighted average of 5.1%. Similarly, the statistical analysis conducted on geographies consisting of 444,684,772 people shows a significant positive correlation between the proportion of Ukrainians and unemploymnet rate among females in the United States with a correlation coefficient (R) of 0.634 and weighted average of 5.0%, a difference of 3.3%.
Female Unemployment Correlation Summary
| Measurement | Palestinian | Ukrainian |
| Minimum | 1.0% | 3.2% |
| Maximum | 22.5% | 44.4% |
| Range | 21.5% | 41.2% |
| Mean | 5.6% | 10.3% |
| Median | 5.0% | 5.8% |
| Interquartile 25% (IQ1) | 4.1% | 4.8% |
| Interquartile 75% (IQ3) | 6.4% | 9.9% |
| Interquartile Range (IQR) | 2.3% | 5.1% |
| Standard Deviation (Sample) | 3.3% | 10.3% |
| Standard Deviation (Population) | 3.3% | 10.2% |
Similar Demographics by Female Unemployment
Demographics Similar to Palestinians by Female Unemployment
In terms of female unemployment, the demographic groups most similar to Palestinians are Immigrants from Kazakhstan (5.1%, a difference of 0.010%), Immigrants from Jordan (5.1%, a difference of 0.040%), Immigrants from Eastern Europe (5.1%, a difference of 0.080%), Immigrants from Oceania (5.2%, a difference of 0.12%), and Immigrants from Norway (5.2%, a difference of 0.13%).
| Demographics | Rating | Rank | Female Unemployment |
| Immigrants | Latvia | 84.6 /100 | #135 | Excellent 5.1% |
| Indians (Asian) | 84.2 /100 | #136 | Excellent 5.1% |
| Pakistanis | 83.8 /100 | #137 | Excellent 5.1% |
| Chickasaw | 83.2 /100 | #138 | Excellent 5.1% |
| Immigrants | Eastern Asia | 83.0 /100 | #139 | Excellent 5.1% |
| Immigrants | France | 82.7 /100 | #140 | Excellent 5.1% |
| Immigrants | Eastern Europe | 81.5 /100 | #141 | Excellent 5.1% |
| Palestinians | 80.8 /100 | #142 | Excellent 5.1% |
| Immigrants | Kazakhstan | 80.7 /100 | #143 | Excellent 5.1% |
| Immigrants | Jordan | 80.4 /100 | #144 | Excellent 5.1% |
| Immigrants | Oceania | 79.5 /100 | #145 | Good 5.2% |
| Immigrants | Norway | 79.4 /100 | #146 | Good 5.2% |
| Argentineans | 79.2 /100 | #147 | Good 5.2% |
| Immigrants | Argentina | 78.7 /100 | #148 | Good 5.2% |
| Asians | 78.3 /100 | #149 | Good 5.2% |
Demographics Similar to Ukrainians by Female Unemployment
In terms of female unemployment, the demographic groups most similar to Ukrainians are Bolivian (5.0%, a difference of 0.010%), Canadian (5.0%, a difference of 0.040%), Immigrants from Serbia (5.0%, a difference of 0.080%), Immigrants from Australia (5.0%, a difference of 0.090%), and Venezuelan (5.0%, a difference of 0.10%).
| Demographics | Rating | Rank | Female Unemployment |
| Immigrants | Netherlands | 97.8 /100 | #78 | Exceptional 5.0% |
| Turks | 97.6 /100 | #79 | Exceptional 5.0% |
| New Zealanders | 97.4 /100 | #80 | Exceptional 5.0% |
| Filipinos | 97.3 /100 | #81 | Exceptional 5.0% |
| Immigrants | Australia | 97.3 /100 | #82 | Exceptional 5.0% |
| Immigrants | Serbia | 97.2 /100 | #83 | Exceptional 5.0% |
| Canadians | 97.2 /100 | #84 | Exceptional 5.0% |
| Ukrainians | 97.1 /100 | #85 | Exceptional 5.0% |
| Bolivians | 97.1 /100 | #86 | Exceptional 5.0% |
| Venezuelans | 96.9 /100 | #87 | Exceptional 5.0% |
| Immigrants | Sudan | 96.7 /100 | #88 | Exceptional 5.0% |
| Immigrants | Taiwan | 96.6 /100 | #89 | Exceptional 5.0% |
| Immigrants | Sweden | 96.3 /100 | #90 | Exceptional 5.0% |
| Immigrants | Japan | 96.0 /100 | #91 | Exceptional 5.0% |
| Romanians | 95.9 /100 | #92 | Exceptional 5.0% |