Australian vs Immigrants from Eastern Europe Female Unemployment
COMPARE
Australian
Immigrants from Eastern Europe
Female Unemployment
Female Unemployment Comparison
Australians
Immigrants from Eastern Europe
4.9%
FEMALE UNEMPLOYMENT
99.2/ 100
METRIC RATING
49th/ 347
METRIC RANK
5.1%
FEMALE UNEMPLOYMENT
81.5/ 100
METRIC RATING
141st/ 347
METRIC RANK
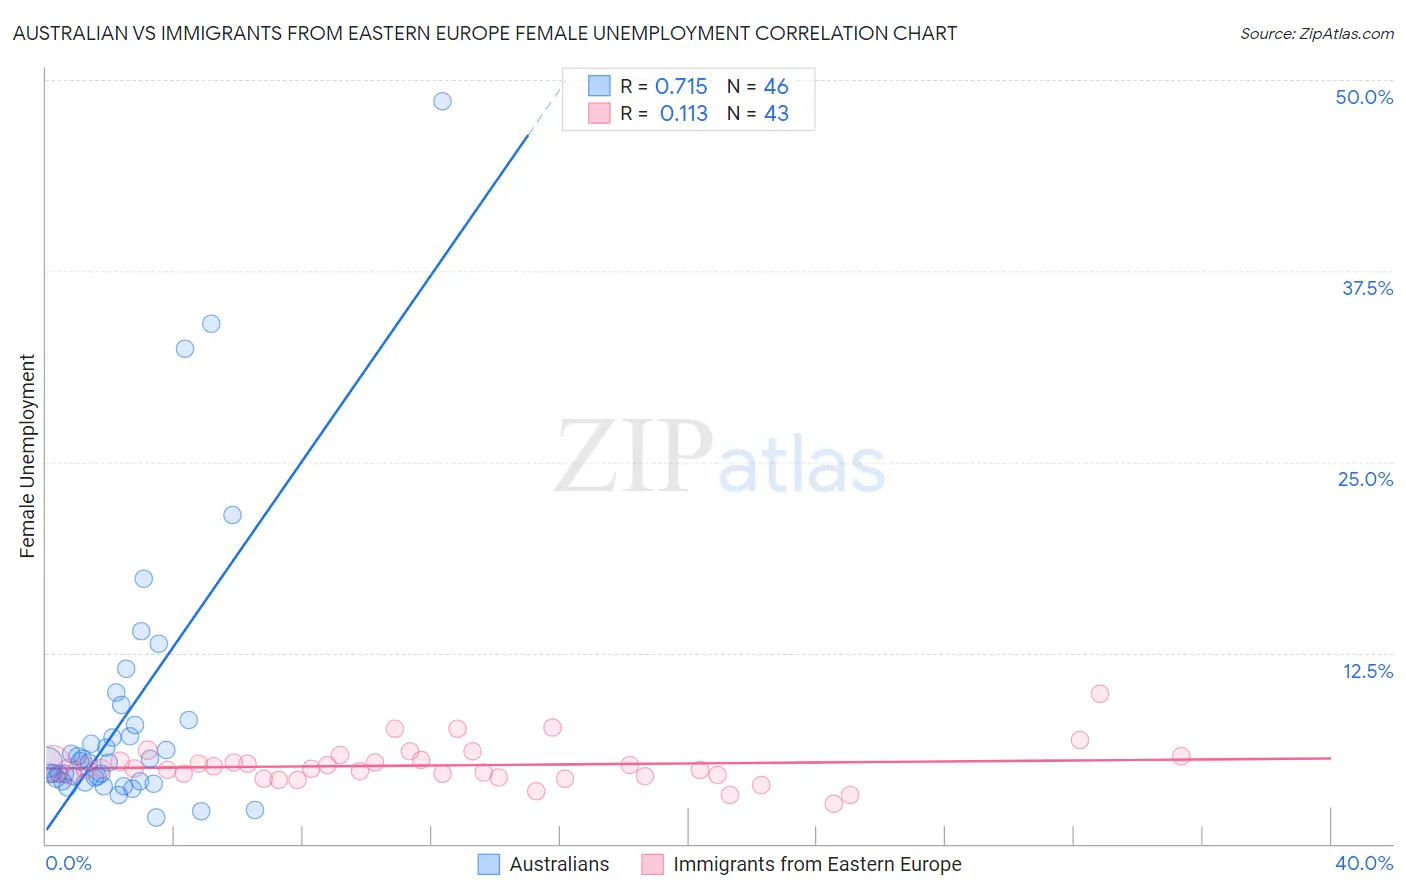
Australian vs Immigrants from Eastern Europe Female Unemployment Correlation Chart
The statistical analysis conducted on geographies consisting of 223,483,579 people shows a strong positive correlation between the proportion of Australians and unemploymnet rate among females in the United States with a correlation coefficient (R) of 0.715 and weighted average of 4.9%. Similarly, the statistical analysis conducted on geographies consisting of 471,678,219 people shows a poor positive correlation between the proportion of Immigrants from Eastern Europe and unemploymnet rate among females in the United States with a correlation coefficient (R) of 0.113 and weighted average of 5.1%, a difference of 5.4%.
Female Unemployment Correlation Summary
| Measurement | Australian | Immigrants from Eastern Europe |
| Minimum | 1.7% | 2.6% |
| Maximum | 48.6% | 9.8% |
| Range | 46.9% | 7.2% |
| Mean | 8.4% | 5.1% |
| Median | 5.3% | 4.9% |
| Interquartile 25% (IQ1) | 4.1% | 4.4% |
| Interquartile 75% (IQ3) | 7.8% | 5.5% |
| Interquartile Range (IQR) | 3.7% | 1.1% |
| Standard Deviation (Sample) | 9.1% | 1.3% |
| Standard Deviation (Population) | 9.0% | 1.3% |
Similar Demographics by Female Unemployment
Demographics Similar to Australians by Female Unemployment
In terms of female unemployment, the demographic groups most similar to Australians are Thai (4.9%, a difference of 0.0%), Okinawan (4.9%, a difference of 0.21%), Immigrants from Cuba (4.9%, a difference of 0.24%), Cambodian (4.9%, a difference of 0.25%), and Slavic (4.9%, a difference of 0.27%).
| Demographics | Rating | Rank | Female Unemployment |
| Italians | 99.5 /100 | #42 | Exceptional 4.8% |
| Eastern Europeans | 99.4 /100 | #43 | Exceptional 4.9% |
| Greeks | 99.4 /100 | #44 | Exceptional 4.9% |
| Austrians | 99.3 /100 | #45 | Exceptional 4.9% |
| Immigrants | Bulgaria | 99.3 /100 | #46 | Exceptional 4.9% |
| Okinawans | 99.3 /100 | #47 | Exceptional 4.9% |
| Thais | 99.2 /100 | #48 | Exceptional 4.9% |
| Australians | 99.2 /100 | #49 | Exceptional 4.9% |
| Immigrants | Cuba | 99.1 /100 | #50 | Exceptional 4.9% |
| Cambodians | 99.1 /100 | #51 | Exceptional 4.9% |
| Slavs | 99.1 /100 | #52 | Exceptional 4.9% |
| Whites/Caucasians | 99.0 /100 | #53 | Exceptional 4.9% |
| Immigrants | Zimbabwe | 99.0 /100 | #54 | Exceptional 4.9% |
| Immigrants | Moldova | 99.0 /100 | #55 | Exceptional 4.9% |
| Serbians | 99.0 /100 | #56 | Exceptional 4.9% |
Demographics Similar to Immigrants from Eastern Europe by Female Unemployment
In terms of female unemployment, the demographic groups most similar to Immigrants from Eastern Europe are Palestinian (5.1%, a difference of 0.080%), Immigrants from Kazakhstan (5.1%, a difference of 0.090%), Immigrants from Jordan (5.1%, a difference of 0.11%), Immigrants from France (5.1%, a difference of 0.12%), and Immigrants from Eastern Asia (5.1%, a difference of 0.16%).
| Demographics | Rating | Rank | Female Unemployment |
| Immigrants | Eritrea | 84.6 /100 | #134 | Excellent 5.1% |
| Immigrants | Latvia | 84.6 /100 | #135 | Excellent 5.1% |
| Indians (Asian) | 84.2 /100 | #136 | Excellent 5.1% |
| Pakistanis | 83.8 /100 | #137 | Excellent 5.1% |
| Chickasaw | 83.2 /100 | #138 | Excellent 5.1% |
| Immigrants | Eastern Asia | 83.0 /100 | #139 | Excellent 5.1% |
| Immigrants | France | 82.7 /100 | #140 | Excellent 5.1% |
| Immigrants | Eastern Europe | 81.5 /100 | #141 | Excellent 5.1% |
| Palestinians | 80.8 /100 | #142 | Excellent 5.1% |
| Immigrants | Kazakhstan | 80.7 /100 | #143 | Excellent 5.1% |
| Immigrants | Jordan | 80.4 /100 | #144 | Excellent 5.1% |
| Immigrants | Oceania | 79.5 /100 | #145 | Good 5.2% |
| Immigrants | Norway | 79.4 /100 | #146 | Good 5.2% |
| Argentineans | 79.2 /100 | #147 | Good 5.2% |
| Immigrants | Argentina | 78.7 /100 | #148 | Good 5.2% |