Immigrants from Colombia vs Puget Sound Salish Unemployment Among Women with Children Ages 6 to 17 years
COMPARE
Immigrants from Colombia
Puget Sound Salish
Unemployment Among Women with Children Ages 6 to 17 years
Unemployment Among Women with Children Ages 6 to 17 years Comparison
Immigrants from Colombia
Puget Sound Salish
9.3%
UNEMPLOYMENT AMONG WOMEN WITH CHILDREN AGES 6 TO 17 YEARS
2.1/ 100
METRIC RATING
242nd/ 347
METRIC RANK
7.5%
UNEMPLOYMENT AMONG WOMEN WITH CHILDREN AGES 6 TO 17 YEARS
100.0/ 100
METRIC RATING
15th/ 347
METRIC RANK
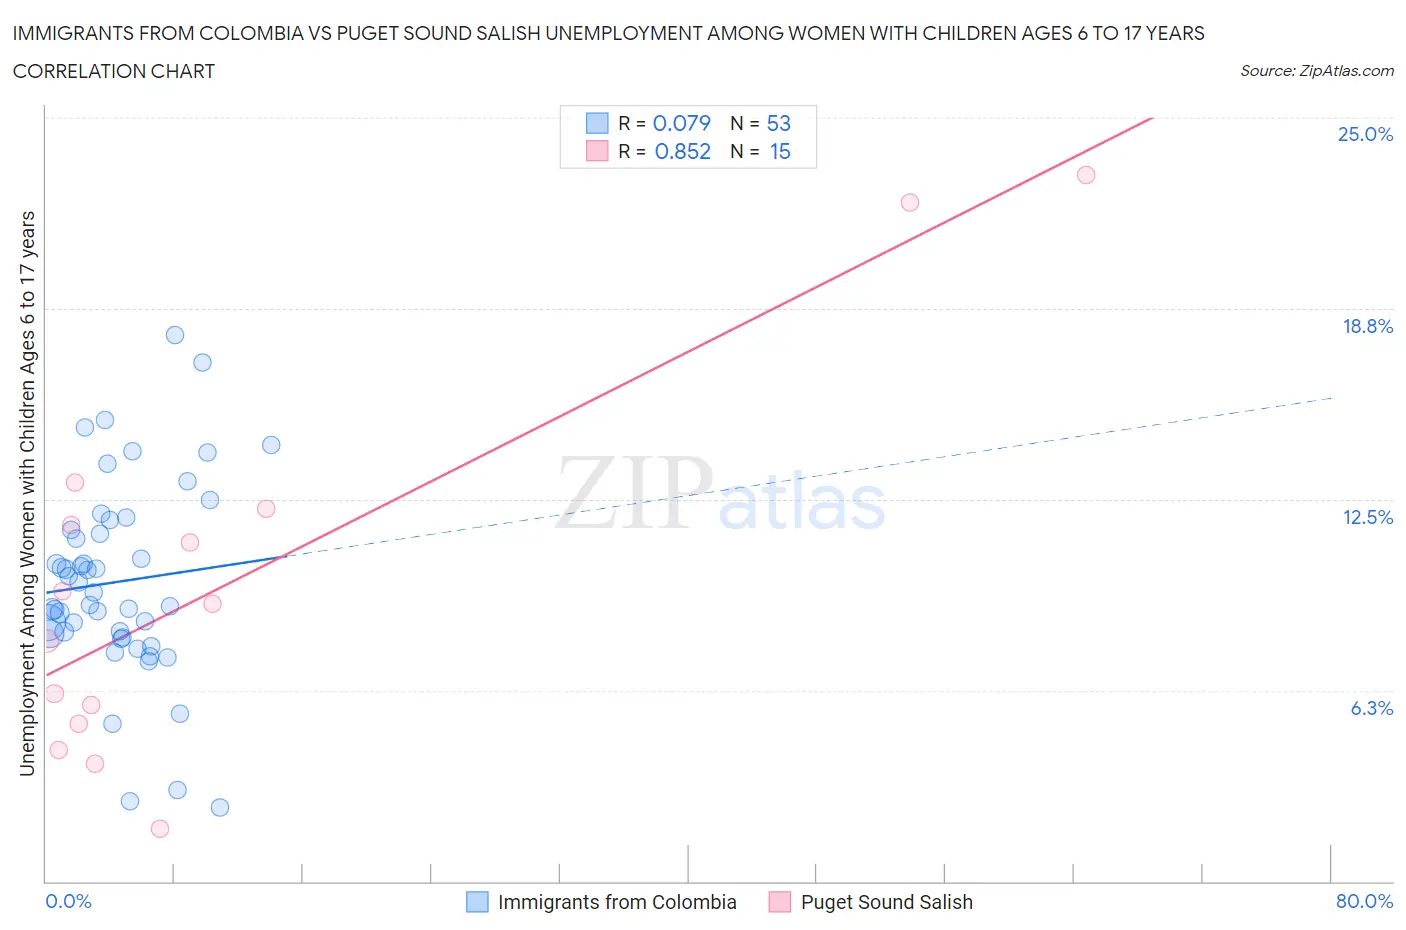
Immigrants from Colombia vs Puget Sound Salish Unemployment Among Women with Children Ages 6 to 17 years Correlation Chart
The statistical analysis conducted on geographies consisting of 278,056,309 people shows a slight positive correlation between the proportion of Immigrants from Colombia and unemployment rate among women with children between the ages 6 and 17 in the United States with a correlation coefficient (R) of 0.079 and weighted average of 9.3%. Similarly, the statistical analysis conducted on geographies consisting of 40,323,487 people shows a very strong positive correlation between the proportion of Puget Sound Salish and unemployment rate among women with children between the ages 6 and 17 in the United States with a correlation coefficient (R) of 0.852 and weighted average of 7.5%, a difference of 24.8%.
Unemployment Among Women with Children Ages 6 to 17 years Correlation Summary
| Measurement | Immigrants from Colombia | Puget Sound Salish |
| Minimum | 2.4% | 1.7% |
| Maximum | 17.9% | 23.1% |
| Range | 15.5% | 21.4% |
| Mean | 9.8% | 9.8% |
| Median | 9.4% | 9.1% |
| Interquartile 25% (IQ1) | 8.0% | 5.2% |
| Interquartile 75% (IQ3) | 11.6% | 12.2% |
| Interquartile Range (IQR) | 3.6% | 7.0% |
| Standard Deviation (Sample) | 3.2% | 6.2% |
| Standard Deviation (Population) | 3.2% | 6.0% |
Similar Demographics by Unemployment Among Women with Children Ages 6 to 17 years
Demographics Similar to Immigrants from Colombia by Unemployment Among Women with Children Ages 6 to 17 years
In terms of unemployment among women with children ages 6 to 17 years, the demographic groups most similar to Immigrants from Colombia are Colombian (9.3%, a difference of 0.020%), Guatemalan (9.3%, a difference of 0.090%), Scottish (9.4%, a difference of 0.090%), English (9.4%, a difference of 0.14%), and Immigrants from Cameroon (9.4%, a difference of 0.17%).
| Demographics | Rating | Rank | Unemployment Among Women with Children Ages 6 to 17 years |
| Uruguayans | 3.0 /100 | #235 | Tragic 9.3% |
| Hungarians | 3.0 /100 | #236 | Tragic 9.3% |
| Immigrants | Belize | 2.8 /100 | #237 | Tragic 9.3% |
| Arabs | 2.7 /100 | #238 | Tragic 9.3% |
| Immigrants | Saudi Arabia | 2.7 /100 | #239 | Tragic 9.3% |
| Guatemalans | 2.3 /100 | #240 | Tragic 9.3% |
| Colombians | 2.2 /100 | #241 | Tragic 9.3% |
| Immigrants | Colombia | 2.1 /100 | #242 | Tragic 9.3% |
| Scottish | 2.0 /100 | #243 | Tragic 9.4% |
| English | 1.9 /100 | #244 | Tragic 9.4% |
| Immigrants | Cameroon | 1.8 /100 | #245 | Tragic 9.4% |
| Immigrants | Africa | 1.6 /100 | #246 | Tragic 9.4% |
| Poles | 1.5 /100 | #247 | Tragic 9.4% |
| Dutch | 1.5 /100 | #248 | Tragic 9.4% |
| Immigrants | South America | 1.5 /100 | #249 | Tragic 9.4% |
Demographics Similar to Puget Sound Salish by Unemployment Among Women with Children Ages 6 to 17 years
In terms of unemployment among women with children ages 6 to 17 years, the demographic groups most similar to Puget Sound Salish are Immigrants from Burma/Myanmar (7.5%, a difference of 0.36%), Cambodian (7.5%, a difference of 0.54%), Sudanese (7.4%, a difference of 1.1%), Indonesian (7.4%, a difference of 1.1%), and Afghan (7.6%, a difference of 1.2%).
| Demographics | Rating | Rank | Unemployment Among Women with Children Ages 6 to 17 years |
| Immigrants | Hong Kong | 100.0 /100 | #8 | Exceptional 7.2% |
| Assyrians/Chaldeans/Syriacs | 100.0 /100 | #9 | Exceptional 7.2% |
| Immigrants | Fiji | 100.0 /100 | #10 | Exceptional 7.3% |
| Immigrants | Taiwan | 100.0 /100 | #11 | Exceptional 7.3% |
| Bangladeshis | 100.0 /100 | #12 | Exceptional 7.4% |
| Indonesians | 100.0 /100 | #13 | Exceptional 7.4% |
| Sudanese | 100.0 /100 | #14 | Exceptional 7.4% |
| Puget Sound Salish | 100.0 /100 | #15 | Exceptional 7.5% |
| Immigrants | Burma/Myanmar | 100.0 /100 | #16 | Exceptional 7.5% |
| Cambodians | 100.0 /100 | #17 | Exceptional 7.5% |
| Afghans | 100.0 /100 | #18 | Exceptional 7.6% |
| Filipinos | 100.0 /100 | #19 | Exceptional 7.6% |
| Immigrants | Singapore | 100.0 /100 | #20 | Exceptional 7.7% |
| Immigrants | India | 100.0 /100 | #21 | Exceptional 7.7% |
| Immigrants | China | 100.0 /100 | #22 | Exceptional 7.7% |