Okinawan vs Immigrants from Argentina Male Unemployment
COMPARE
Okinawan
Immigrants from Argentina
Male Unemployment
Male Unemployment Comparison
Okinawans
Immigrants from Argentina
5.1%
MALE UNEMPLOYMENT
94.7/ 100
METRIC RATING
90th/ 347
METRIC RANK
5.0%
MALE UNEMPLOYMENT
98.1/ 100
METRIC RATING
60th/ 347
METRIC RANK
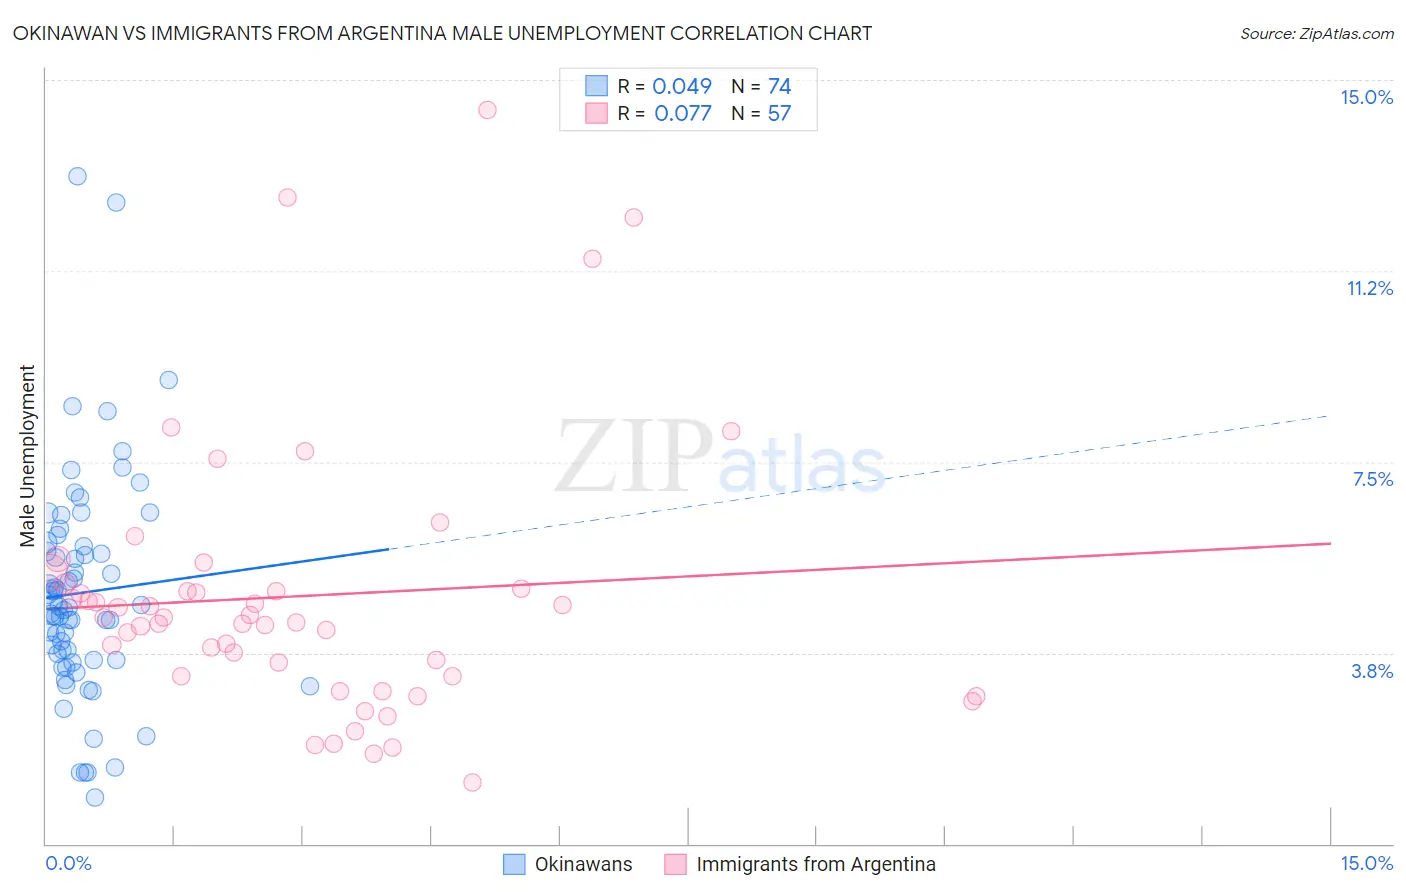
Okinawan vs Immigrants from Argentina Male Unemployment Correlation Chart
The statistical analysis conducted on geographies consisting of 73,756,692 people shows no correlation between the proportion of Okinawans and unemployment rate among males in the United States with a correlation coefficient (R) of 0.049 and weighted average of 5.1%. Similarly, the statistical analysis conducted on geographies consisting of 264,057,783 people shows a slight positive correlation between the proportion of Immigrants from Argentina and unemployment rate among males in the United States with a correlation coefficient (R) of 0.077 and weighted average of 5.0%, a difference of 1.7%.
Male Unemployment Correlation Summary
| Measurement | Okinawan | Immigrants from Argentina |
| Minimum | 0.90% | 1.2% |
| Maximum | 13.1% | 14.4% |
| Range | 12.2% | 13.2% |
| Mean | 4.9% | 4.9% |
| Median | 4.7% | 4.4% |
| Interquartile 25% (IQ1) | 3.6% | 3.3% |
| Interquartile 75% (IQ3) | 5.9% | 5.1% |
| Interquartile Range (IQR) | 2.3% | 1.8% |
| Standard Deviation (Sample) | 2.2% | 2.7% |
| Standard Deviation (Population) | 2.2% | 2.6% |
Similar Demographics by Male Unemployment
Demographics Similar to Okinawans by Male Unemployment
In terms of male unemployment, the demographic groups most similar to Okinawans are Immigrants from Australia (5.1%, a difference of 0.010%), Immigrants from Sri Lanka (5.1%, a difference of 0.040%), Immigrants from Turkey (5.1%, a difference of 0.080%), Slavic (5.1%, a difference of 0.14%), and Immigrants from Serbia (5.1%, a difference of 0.14%).
| Demographics | Rating | Rank | Male Unemployment |
| Immigrants | Eritrea | 96.0 /100 | #83 | Exceptional 5.0% |
| Serbians | 95.7 /100 | #84 | Exceptional 5.1% |
| Immigrants | North Macedonia | 95.6 /100 | #85 | Exceptional 5.1% |
| Maltese | 95.5 /100 | #86 | Exceptional 5.1% |
| Immigrants | Romania | 95.4 /100 | #87 | Exceptional 5.1% |
| Immigrants | Sri Lanka | 94.9 /100 | #88 | Exceptional 5.1% |
| Immigrants | Australia | 94.7 /100 | #89 | Exceptional 5.1% |
| Okinawans | 94.7 /100 | #90 | Exceptional 5.1% |
| Immigrants | Turkey | 94.4 /100 | #91 | Exceptional 5.1% |
| Slavs | 94.2 /100 | #92 | Exceptional 5.1% |
| Immigrants | Serbia | 94.2 /100 | #93 | Exceptional 5.1% |
| Canadians | 94.1 /100 | #94 | Exceptional 5.1% |
| Italians | 93.8 /100 | #95 | Exceptional 5.1% |
| Asians | 93.7 /100 | #96 | Exceptional 5.1% |
| Immigrants | Spain | 93.4 /100 | #97 | Exceptional 5.1% |
Demographics Similar to Immigrants from Argentina by Male Unemployment
In terms of male unemployment, the demographic groups most similar to Immigrants from Argentina are Cambodian (5.0%, a difference of 0.080%), Immigrants from Netherlands (5.0%, a difference of 0.18%), Basque (5.0%, a difference of 0.20%), Eastern European (5.0%, a difference of 0.22%), and Celtic (5.0%, a difference of 0.24%).
| Demographics | Rating | Rank | Male Unemployment |
| Jordanians | 98.8 /100 | #53 | Exceptional 5.0% |
| Yugoslavians | 98.7 /100 | #54 | Exceptional 5.0% |
| Czechoslovakians | 98.7 /100 | #55 | Exceptional 5.0% |
| Immigrants | Bulgaria | 98.7 /100 | #56 | Exceptional 5.0% |
| Turks | 98.5 /100 | #57 | Exceptional 5.0% |
| Lithuanians | 98.5 /100 | #58 | Exceptional 5.0% |
| Immigrants | Netherlands | 98.3 /100 | #59 | Exceptional 5.0% |
| Immigrants | Argentina | 98.1 /100 | #60 | Exceptional 5.0% |
| Cambodians | 98.1 /100 | #61 | Exceptional 5.0% |
| Basques | 97.9 /100 | #62 | Exceptional 5.0% |
| Eastern Europeans | 97.9 /100 | #63 | Exceptional 5.0% |
| Celtics | 97.8 /100 | #64 | Exceptional 5.0% |
| Icelanders | 97.6 /100 | #65 | Exceptional 5.0% |
| Finns | 97.5 /100 | #66 | Exceptional 5.0% |
| Immigrants | Canada | 97.5 /100 | #67 | Exceptional 5.0% |