Okinawan vs German Russian Male Unemployment
COMPARE
Okinawan
German Russian
Male Unemployment
Male Unemployment Comparison
Okinawans
German Russians
5.1%
MALE UNEMPLOYMENT
94.7/ 100
METRIC RATING
90th/ 347
METRIC RANK
5.1%
MALE UNEMPLOYMENT
92.7/ 100
METRIC RATING
101st/ 347
METRIC RANK
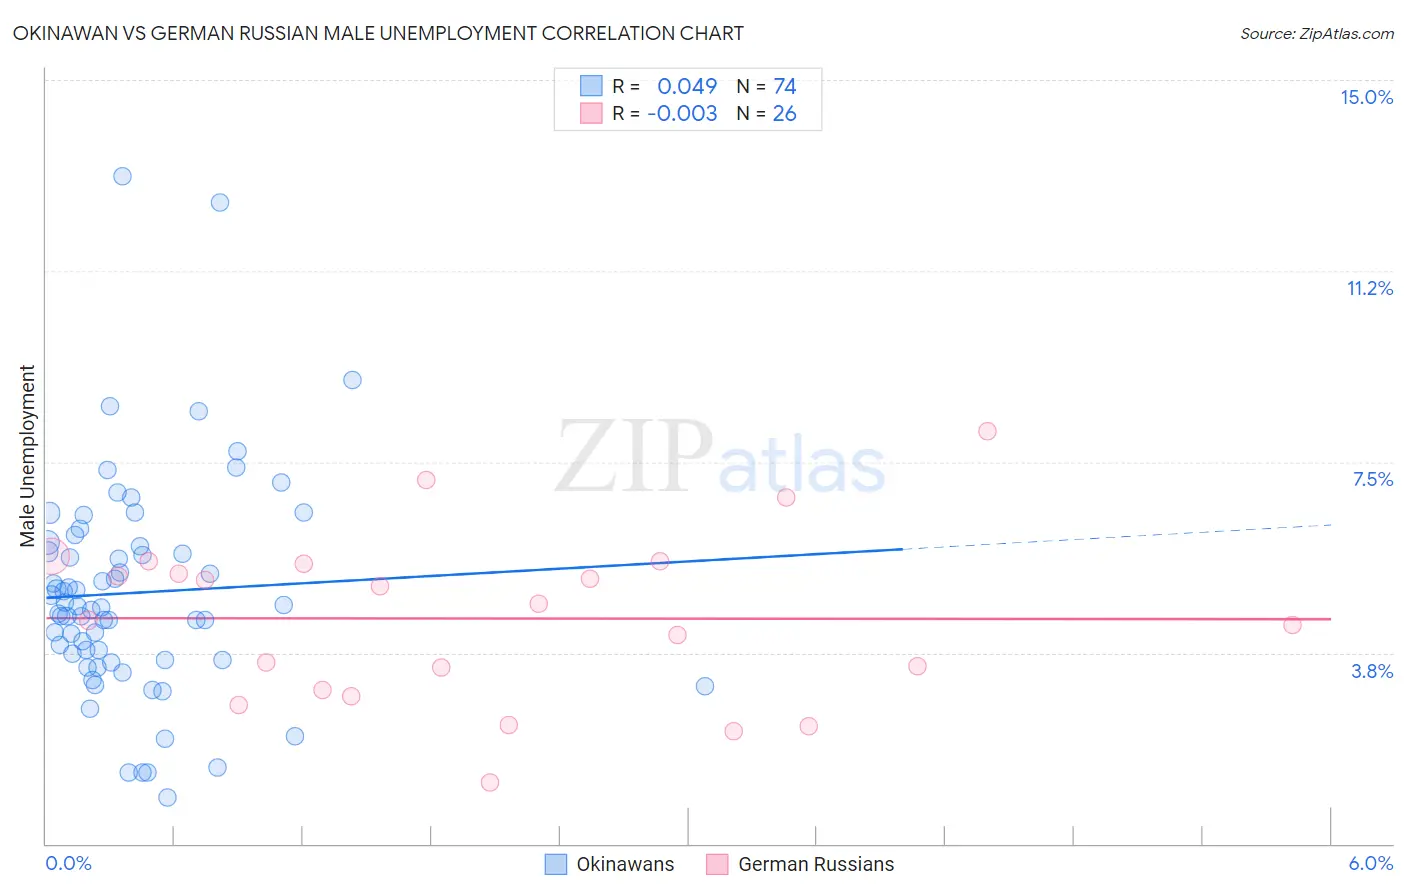
Okinawan vs German Russian Male Unemployment Correlation Chart
The statistical analysis conducted on geographies consisting of 73,756,692 people shows no correlation between the proportion of Okinawans and unemployment rate among males in the United States with a correlation coefficient (R) of 0.049 and weighted average of 5.1%. Similarly, the statistical analysis conducted on geographies consisting of 96,273,571 people shows no correlation between the proportion of German Russians and unemployment rate among males in the United States with a correlation coefficient (R) of -0.003 and weighted average of 5.1%, a difference of 0.52%.
Male Unemployment Correlation Summary
| Measurement | Okinawan | German Russian |
| Minimum | 0.90% | 1.2% |
| Maximum | 13.1% | 8.1% |
| Range | 12.2% | 6.9% |
| Mean | 4.9% | 4.4% |
| Median | 4.7% | 4.6% |
| Interquartile 25% (IQ1) | 3.6% | 3.0% |
| Interquartile 75% (IQ3) | 5.9% | 5.5% |
| Interquartile Range (IQR) | 2.3% | 2.5% |
| Standard Deviation (Sample) | 2.2% | 1.7% |
| Standard Deviation (Population) | 2.2% | 1.6% |
Demographics Similar to Okinawans and German Russians by Male Unemployment
In terms of male unemployment, the demographic groups most similar to Okinawans are Immigrants from Australia (5.1%, a difference of 0.010%), Immigrants from Sri Lanka (5.1%, a difference of 0.040%), Immigrants from Turkey (5.1%, a difference of 0.080%), Slavic (5.1%, a difference of 0.14%), and Immigrants from Serbia (5.1%, a difference of 0.14%). Similarly, the demographic groups most similar to German Russians are Immigrants from France (5.1%, a difference of 0.020%), Russian (5.1%, a difference of 0.040%), Uruguayan (5.1%, a difference of 0.060%), Immigrants from Kuwait (5.1%, a difference of 0.12%), and Immigrants from Spain (5.1%, a difference of 0.16%).
| Demographics | Rating | Rank | Male Unemployment |
| Immigrants | North Macedonia | 95.6 /100 | #85 | Exceptional 5.1% |
| Maltese | 95.5 /100 | #86 | Exceptional 5.1% |
| Immigrants | Romania | 95.4 /100 | #87 | Exceptional 5.1% |
| Immigrants | Sri Lanka | 94.9 /100 | #88 | Exceptional 5.1% |
| Immigrants | Australia | 94.7 /100 | #89 | Exceptional 5.1% |
| Okinawans | 94.7 /100 | #90 | Exceptional 5.1% |
| Immigrants | Turkey | 94.4 /100 | #91 | Exceptional 5.1% |
| Slavs | 94.2 /100 | #92 | Exceptional 5.1% |
| Immigrants | Serbia | 94.2 /100 | #93 | Exceptional 5.1% |
| Canadians | 94.1 /100 | #94 | Exceptional 5.1% |
| Italians | 93.8 /100 | #95 | Exceptional 5.1% |
| Asians | 93.7 /100 | #96 | Exceptional 5.1% |
| Immigrants | Spain | 93.4 /100 | #97 | Exceptional 5.1% |
| Immigrants | Kuwait | 93.3 /100 | #98 | Exceptional 5.1% |
| Uruguayans | 93.0 /100 | #99 | Exceptional 5.1% |
| Russians | 92.9 /100 | #100 | Exceptional 5.1% |
| German Russians | 92.7 /100 | #101 | Exceptional 5.1% |
| Immigrants | France | 92.7 /100 | #102 | Exceptional 5.1% |
| Immigrants | Jordan | 91.9 /100 | #103 | Exceptional 5.1% |
| Immigrants | Chile | 91.8 /100 | #104 | Exceptional 5.1% |
| Immigrants | Czechoslovakia | 91.7 /100 | #105 | Exceptional 5.1% |