Norwegian vs Romanian 10th Grade
COMPARE
Norwegian
Romanian
10th Grade
10th Grade Comparison
Norwegians
Romanians
96.2%
10TH GRADE
100.0/ 100
METRIC RATING
1st/ 347
METRIC RANK
94.8%
10TH GRADE
99.5/ 100
METRIC RATING
76th/ 347
METRIC RANK
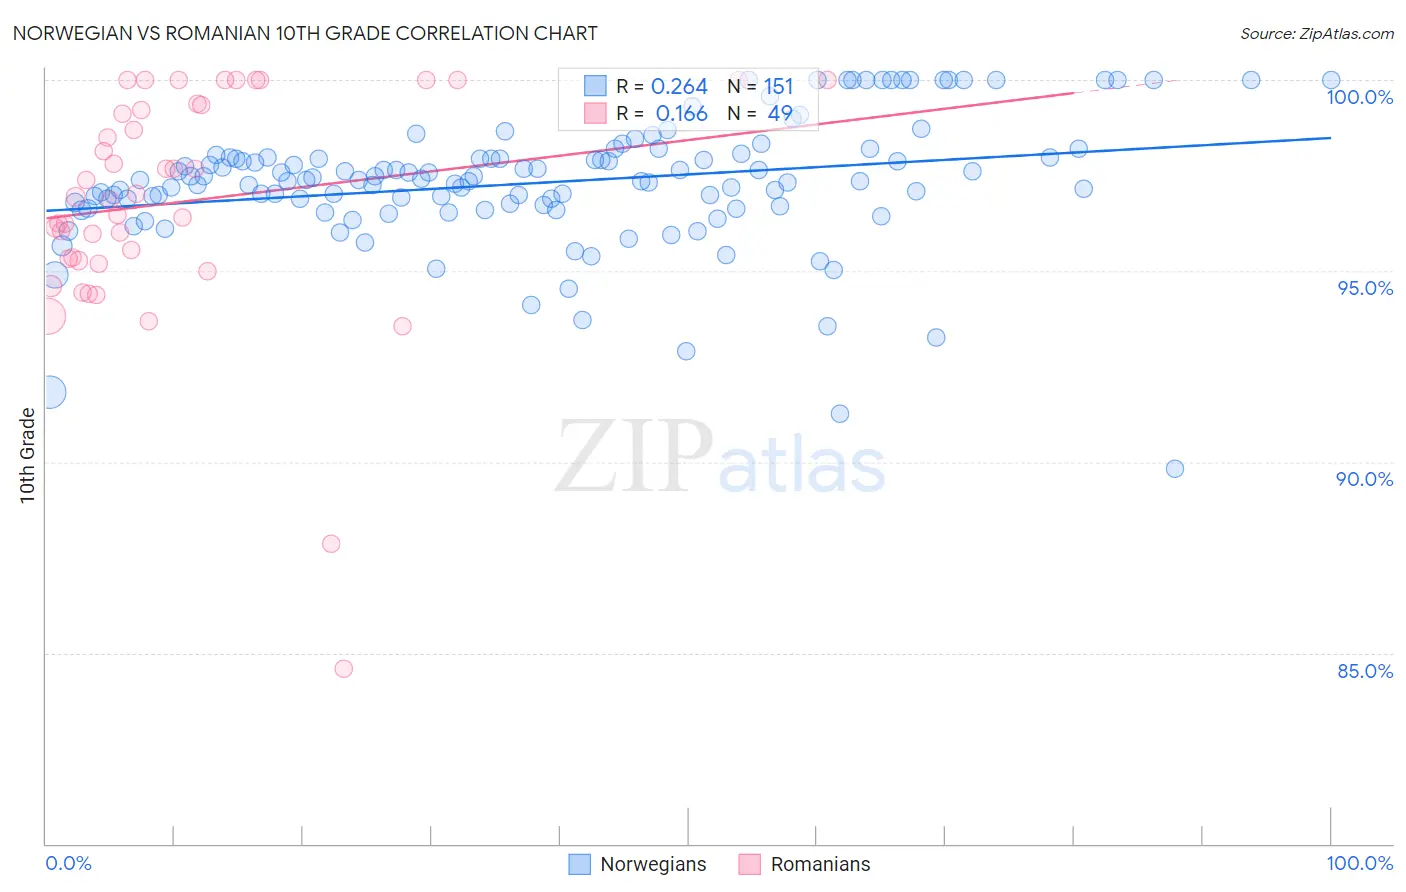
Norwegian vs Romanian 10th Grade Correlation Chart
The statistical analysis conducted on geographies consisting of 533,395,175 people shows a weak positive correlation between the proportion of Norwegians and percentage of population with at least 10th grade education in the United States with a correlation coefficient (R) of 0.264 and weighted average of 96.2%. Similarly, the statistical analysis conducted on geographies consisting of 377,905,060 people shows a poor positive correlation between the proportion of Romanians and percentage of population with at least 10th grade education in the United States with a correlation coefficient (R) of 0.166 and weighted average of 94.8%, a difference of 1.4%.
10th Grade Correlation Summary
| Measurement | Norwegian | Romanian |
| Minimum | 89.8% | 84.6% |
| Maximum | 100.0% | 100.0% |
| Range | 10.2% | 15.4% |
| Mean | 97.3% | 96.8% |
| Median | 97.4% | 96.9% |
| Interquartile 25% (IQ1) | 96.7% | 95.3% |
| Interquartile 75% (IQ3) | 98.0% | 99.4% |
| Interquartile Range (IQR) | 1.3% | 4.1% |
| Standard Deviation (Sample) | 1.7% | 3.1% |
| Standard Deviation (Population) | 1.7% | 3.0% |
Similar Demographics by 10th Grade
Demographics Similar to Norwegians by 10th Grade
In terms of 10th grade, the demographic groups most similar to Norwegians are Slovak (96.0%, a difference of 0.13%), Slovene (95.9%, a difference of 0.24%), Swedish (95.9%, a difference of 0.24%), Carpatho Rusyn (95.9%, a difference of 0.26%), and Polish (95.8%, a difference of 0.36%).
| Demographics | Rating | Rank | 10th Grade |
| Norwegians | 100.0 /100 | #1 | Exceptional 96.2% |
| Slovaks | 100.0 /100 | #2 | Exceptional 96.0% |
| Slovenes | 100.0 /100 | #3 | Exceptional 95.9% |
| Swedes | 100.0 /100 | #4 | Exceptional 95.9% |
| Carpatho Rusyns | 100.0 /100 | #5 | Exceptional 95.9% |
| Poles | 100.0 /100 | #6 | Exceptional 95.8% |
| Germans | 100.0 /100 | #7 | Exceptional 95.8% |
| Lithuanians | 100.0 /100 | #8 | Exceptional 95.8% |
| Finns | 100.0 /100 | #9 | Exceptional 95.8% |
| Croatians | 100.0 /100 | #10 | Exceptional 95.7% |
| Danes | 100.0 /100 | #11 | Exceptional 95.7% |
| Tlingit-Haida | 100.0 /100 | #12 | Exceptional 95.7% |
| English | 100.0 /100 | #13 | Exceptional 95.6% |
| Tsimshian | 100.0 /100 | #14 | Exceptional 95.6% |
| Irish | 100.0 /100 | #15 | Exceptional 95.6% |
Demographics Similar to Romanians by 10th Grade
In terms of 10th grade, the demographic groups most similar to Romanians are Immigrants from South Africa (94.8%, a difference of 0.0%), Okinawan (94.8%, a difference of 0.010%), Bhutanese (94.9%, a difference of 0.040%), Canadian (94.9%, a difference of 0.040%), and Immigrants from Sweden (94.9%, a difference of 0.050%).
| Demographics | Rating | Rank | 10th Grade |
| Immigrants | England | 99.6 /100 | #69 | Exceptional 94.9% |
| Zimbabweans | 99.6 /100 | #70 | Exceptional 94.9% |
| Alaska Natives | 99.6 /100 | #71 | Exceptional 94.9% |
| Immigrants | Sweden | 99.6 /100 | #72 | Exceptional 94.9% |
| Bhutanese | 99.6 /100 | #73 | Exceptional 94.9% |
| Canadians | 99.6 /100 | #74 | Exceptional 94.9% |
| Okinawans | 99.5 /100 | #75 | Exceptional 94.8% |
| Romanians | 99.5 /100 | #76 | Exceptional 94.8% |
| Immigrants | South Africa | 99.5 /100 | #77 | Exceptional 94.8% |
| Filipinos | 99.3 /100 | #78 | Exceptional 94.8% |
| Immigrants | Czechoslovakia | 99.2 /100 | #79 | Exceptional 94.7% |
| Immigrants | Denmark | 99.2 /100 | #80 | Exceptional 94.7% |
| Immigrants | Latvia | 99.2 /100 | #81 | Exceptional 94.7% |
| Swiss | 99.1 /100 | #82 | Exceptional 94.7% |
| Immigrants | Western Europe | 99.1 /100 | #83 | Exceptional 94.7% |