Native Hawaiian vs Menominee Unemployment
COMPARE
Native Hawaiian
Menominee
Unemployment
Unemployment Comparison
Native Hawaiians
Menominee
5.3%
UNEMPLOYMENT
24.1/ 100
METRIC RATING
205th/ 347
METRIC RANK
6.4%
UNEMPLOYMENT
0.0/ 100
METRIC RATING
305th/ 347
METRIC RANK
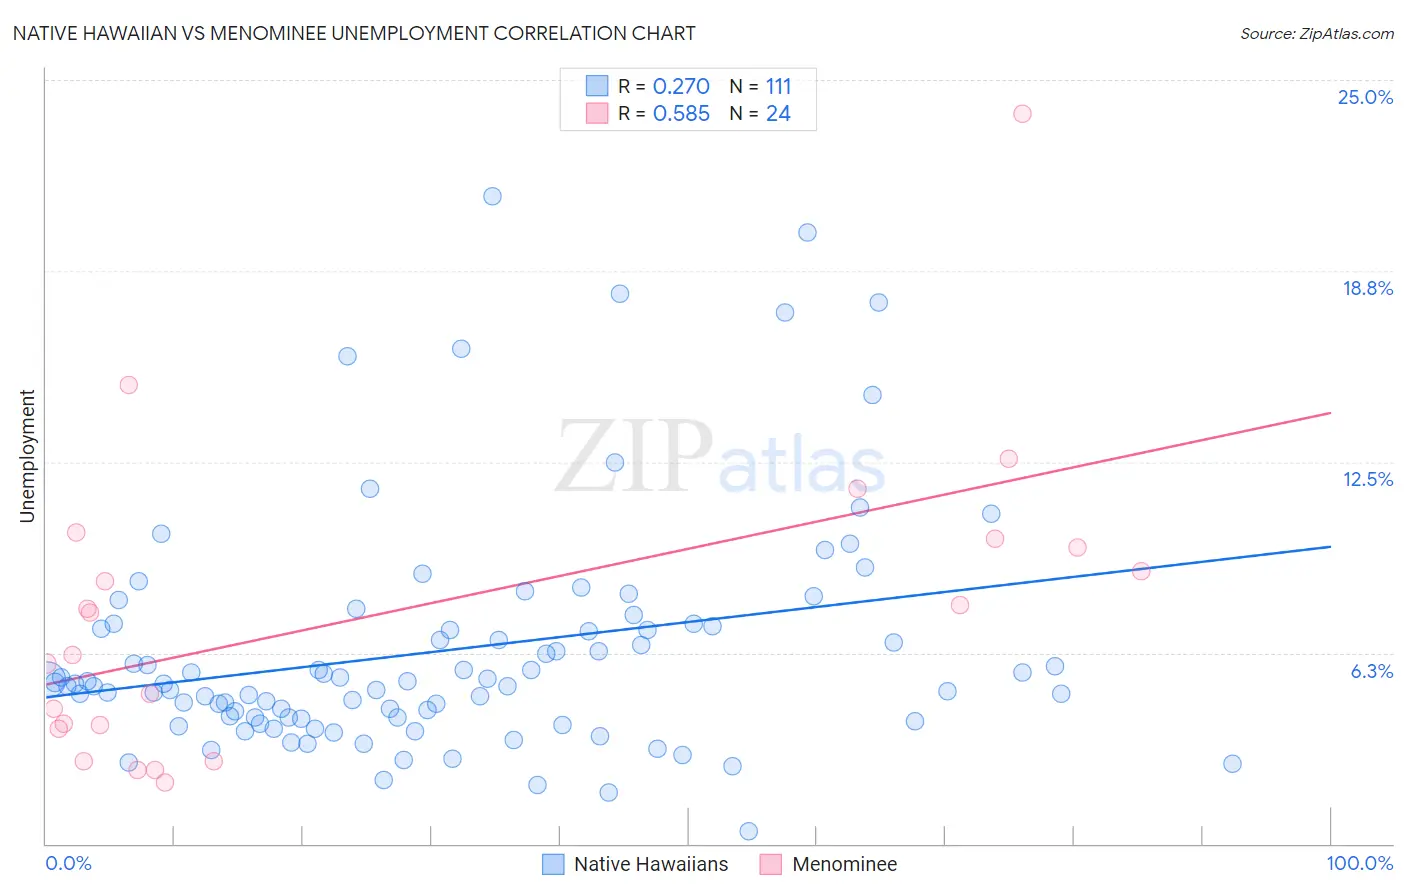
Native Hawaiian vs Menominee Unemployment Correlation Chart
The statistical analysis conducted on geographies consisting of 331,714,087 people shows a weak positive correlation between the proportion of Native Hawaiians and unemployment in the United States with a correlation coefficient (R) of 0.270 and weighted average of 5.3%. Similarly, the statistical analysis conducted on geographies consisting of 45,752,789 people shows a substantial positive correlation between the proportion of Menominee and unemployment in the United States with a correlation coefficient (R) of 0.585 and weighted average of 6.4%, a difference of 20.3%.
Unemployment Correlation Summary
| Measurement | Native Hawaiian | Menominee |
| Minimum | 0.40% | 2.0% |
| Maximum | 21.2% | 23.9% |
| Range | 20.8% | 21.9% |
| Mean | 6.3% | 7.4% |
| Median | 5.3% | 6.9% |
| Interquartile 25% (IQ1) | 4.1% | 3.8% |
| Interquartile 75% (IQ3) | 7.1% | 9.8% |
| Interquartile Range (IQR) | 3.0% | 6.0% |
| Standard Deviation (Sample) | 3.9% | 5.0% |
| Standard Deviation (Population) | 3.8% | 4.9% |
Similar Demographics by Unemployment
Demographics Similar to Native Hawaiians by Unemployment
In terms of unemployment, the demographic groups most similar to Native Hawaiians are Immigrants from Ukraine (5.3%, a difference of 0.060%), Immigrants from Micronesia (5.3%, a difference of 0.080%), Cherokee (5.3%, a difference of 0.11%), Immigrants from Peru (5.4%, a difference of 0.13%), and Immigrants from South Eastern Asia (5.3%, a difference of 0.23%).
| Demographics | Rating | Rank | Unemployment |
| Immigrants | Israel | 28.6 /100 | #198 | Fair 5.3% |
| Immigrants | Afghanistan | 28.6 /100 | #199 | Fair 5.3% |
| Koreans | 27.4 /100 | #200 | Fair 5.3% |
| Immigrants | South Eastern Asia | 27.0 /100 | #201 | Fair 5.3% |
| Cherokee | 25.5 /100 | #202 | Fair 5.3% |
| Immigrants | Micronesia | 25.2 /100 | #203 | Fair 5.3% |
| Immigrants | Ukraine | 24.9 /100 | #204 | Fair 5.3% |
| Native Hawaiians | 24.1 /100 | #205 | Fair 5.3% |
| Immigrants | Peru | 22.7 /100 | #206 | Fair 5.4% |
| Creek | 19.4 /100 | #207 | Poor 5.4% |
| Portuguese | 19.0 /100 | #208 | Poor 5.4% |
| Immigrants | Iran | 18.8 /100 | #209 | Poor 5.4% |
| Immigrants | Iraq | 18.6 /100 | #210 | Poor 5.4% |
| Iraqis | 18.1 /100 | #211 | Poor 5.4% |
| Ugandans | 18.0 /100 | #212 | Poor 5.4% |
Demographics Similar to Menominee by Unemployment
In terms of unemployment, the demographic groups most similar to Menominee are Lumbee (6.4%, a difference of 0.030%), Immigrants from Jamaica (6.4%, a difference of 0.25%), Immigrants from Bangladesh (6.5%, a difference of 0.52%), Barbadian (6.5%, a difference of 0.89%), and Vietnamese (6.5%, a difference of 0.90%).
| Demographics | Rating | Rank | Unemployment |
| Immigrants | Haiti | 0.0 /100 | #298 | Tragic 6.3% |
| Immigrants | West Indies | 0.0 /100 | #299 | Tragic 6.3% |
| Immigrants | Trinidad and Tobago | 0.0 /100 | #300 | Tragic 6.3% |
| Trinidadians and Tobagonians | 0.0 /100 | #301 | Tragic 6.3% |
| West Indians | 0.0 /100 | #302 | Tragic 6.4% |
| Belizeans | 0.0 /100 | #303 | Tragic 6.4% |
| Immigrants | Jamaica | 0.0 /100 | #304 | Tragic 6.4% |
| Menominee | 0.0 /100 | #305 | Tragic 6.4% |
| Lumbee | 0.0 /100 | #306 | Tragic 6.4% |
| Immigrants | Bangladesh | 0.0 /100 | #307 | Tragic 6.5% |
| Barbadians | 0.0 /100 | #308 | Tragic 6.5% |
| Vietnamese | 0.0 /100 | #309 | Tragic 6.5% |
| Immigrants | Belize | 0.0 /100 | #310 | Tragic 6.5% |
| Cape Verdeans | 0.0 /100 | #311 | Tragic 6.5% |
| Colville | 0.0 /100 | #312 | Tragic 6.6% |