Immigrants from Spain vs Menominee Unemployment
COMPARE
Immigrants from Spain
Menominee
Unemployment
Unemployment Comparison
Immigrants from Spain
Menominee
5.1%
UNEMPLOYMENT
86.2/ 100
METRIC RATING
136th/ 347
METRIC RANK
6.4%
UNEMPLOYMENT
0.0/ 100
METRIC RATING
305th/ 347
METRIC RANK
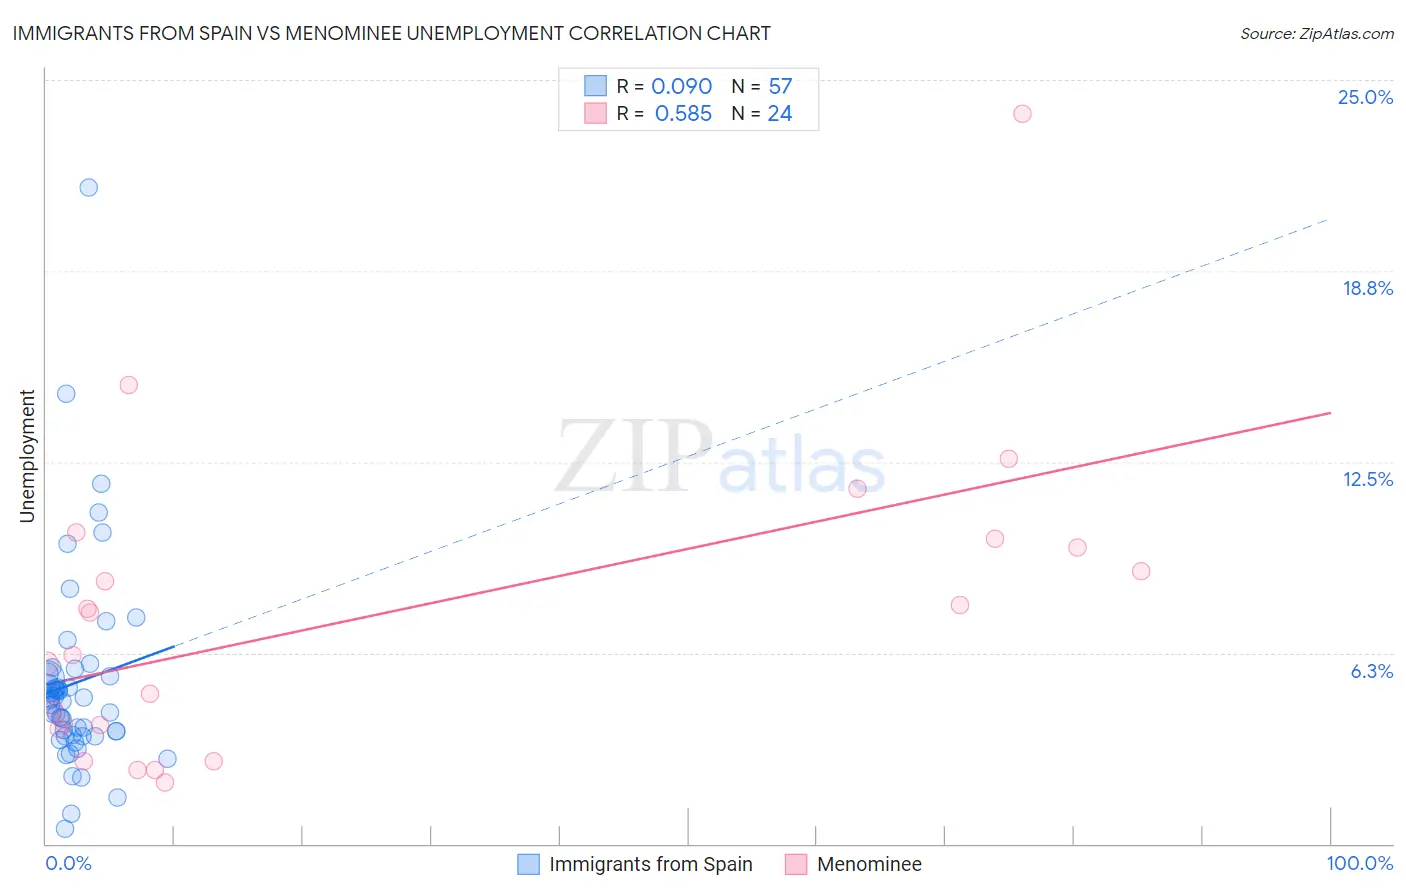
Immigrants from Spain vs Menominee Unemployment Correlation Chart
The statistical analysis conducted on geographies consisting of 239,621,444 people shows a slight positive correlation between the proportion of Immigrants from Spain and unemployment in the United States with a correlation coefficient (R) of 0.090 and weighted average of 5.1%. Similarly, the statistical analysis conducted on geographies consisting of 45,752,789 people shows a substantial positive correlation between the proportion of Menominee and unemployment in the United States with a correlation coefficient (R) of 0.585 and weighted average of 6.4%, a difference of 26.0%.
Unemployment Correlation Summary
| Measurement | Immigrants from Spain | Menominee |
| Minimum | 0.50% | 2.0% |
| Maximum | 21.5% | 23.9% |
| Range | 21.0% | 21.9% |
| Mean | 5.3% | 7.4% |
| Median | 4.7% | 6.9% |
| Interquartile 25% (IQ1) | 3.5% | 3.8% |
| Interquartile 75% (IQ3) | 5.5% | 9.8% |
| Interquartile Range (IQR) | 2.0% | 6.0% |
| Standard Deviation (Sample) | 3.4% | 5.0% |
| Standard Deviation (Population) | 3.3% | 4.9% |
Similar Demographics by Unemployment
Demographics Similar to Immigrants from Spain by Unemployment
In terms of unemployment, the demographic groups most similar to Immigrants from Spain are Immigrants from Europe (5.1%, a difference of 0.010%), Immigrants from Burma/Myanmar (5.1%, a difference of 0.010%), Immigrants from Jordan (5.1%, a difference of 0.060%), Immigrants from Croatia (5.1%, a difference of 0.070%), and Immigrants from Ethiopia (5.1%, a difference of 0.070%).
| Demographics | Rating | Rank | Unemployment |
| Immigrants | Latvia | 88.0 /100 | #129 | Excellent 5.1% |
| Iranians | 86.9 /100 | #130 | Excellent 5.1% |
| Immigrants | Croatia | 86.8 /100 | #131 | Excellent 5.1% |
| Immigrants | Ethiopia | 86.7 /100 | #132 | Excellent 5.1% |
| Immigrants | Jordan | 86.6 /100 | #133 | Excellent 5.1% |
| Immigrants | Europe | 86.3 /100 | #134 | Excellent 5.1% |
| Immigrants | Burma/Myanmar | 86.2 /100 | #135 | Excellent 5.1% |
| Immigrants | Spain | 86.2 /100 | #136 | Excellent 5.1% |
| Immigrants | Saudi Arabia | 85.6 /100 | #137 | Excellent 5.1% |
| Immigrants | Hungary | 85.6 /100 | #138 | Excellent 5.1% |
| Pakistanis | 85.3 /100 | #139 | Excellent 5.1% |
| Immigrants | Denmark | 84.3 /100 | #140 | Excellent 5.1% |
| Palestinians | 83.4 /100 | #141 | Excellent 5.1% |
| Immigrants | Pakistan | 83.2 /100 | #142 | Excellent 5.1% |
| Immigrants | Chile | 82.8 /100 | #143 | Excellent 5.1% |
Demographics Similar to Menominee by Unemployment
In terms of unemployment, the demographic groups most similar to Menominee are Lumbee (6.4%, a difference of 0.030%), Immigrants from Jamaica (6.4%, a difference of 0.25%), Immigrants from Bangladesh (6.5%, a difference of 0.52%), Barbadian (6.5%, a difference of 0.89%), and Vietnamese (6.5%, a difference of 0.90%).
| Demographics | Rating | Rank | Unemployment |
| Immigrants | Haiti | 0.0 /100 | #298 | Tragic 6.3% |
| Immigrants | West Indies | 0.0 /100 | #299 | Tragic 6.3% |
| Immigrants | Trinidad and Tobago | 0.0 /100 | #300 | Tragic 6.3% |
| Trinidadians and Tobagonians | 0.0 /100 | #301 | Tragic 6.3% |
| West Indians | 0.0 /100 | #302 | Tragic 6.4% |
| Belizeans | 0.0 /100 | #303 | Tragic 6.4% |
| Immigrants | Jamaica | 0.0 /100 | #304 | Tragic 6.4% |
| Menominee | 0.0 /100 | #305 | Tragic 6.4% |
| Lumbee | 0.0 /100 | #306 | Tragic 6.4% |
| Immigrants | Bangladesh | 0.0 /100 | #307 | Tragic 6.5% |
| Barbadians | 0.0 /100 | #308 | Tragic 6.5% |
| Vietnamese | 0.0 /100 | #309 | Tragic 6.5% |
| Immigrants | Belize | 0.0 /100 | #310 | Tragic 6.5% |
| Cape Verdeans | 0.0 /100 | #311 | Tragic 6.5% |
| Colville | 0.0 /100 | #312 | Tragic 6.6% |