Immigrants from South Central Asia vs Menominee Unemployment
COMPARE
Immigrants from South Central Asia
Menominee
Unemployment
Unemployment Comparison
Immigrants from South Central Asia
Menominee
4.9%
UNEMPLOYMENT
99.3/ 100
METRIC RATING
49th/ 347
METRIC RANK
6.4%
UNEMPLOYMENT
0.0/ 100
METRIC RATING
305th/ 347
METRIC RANK
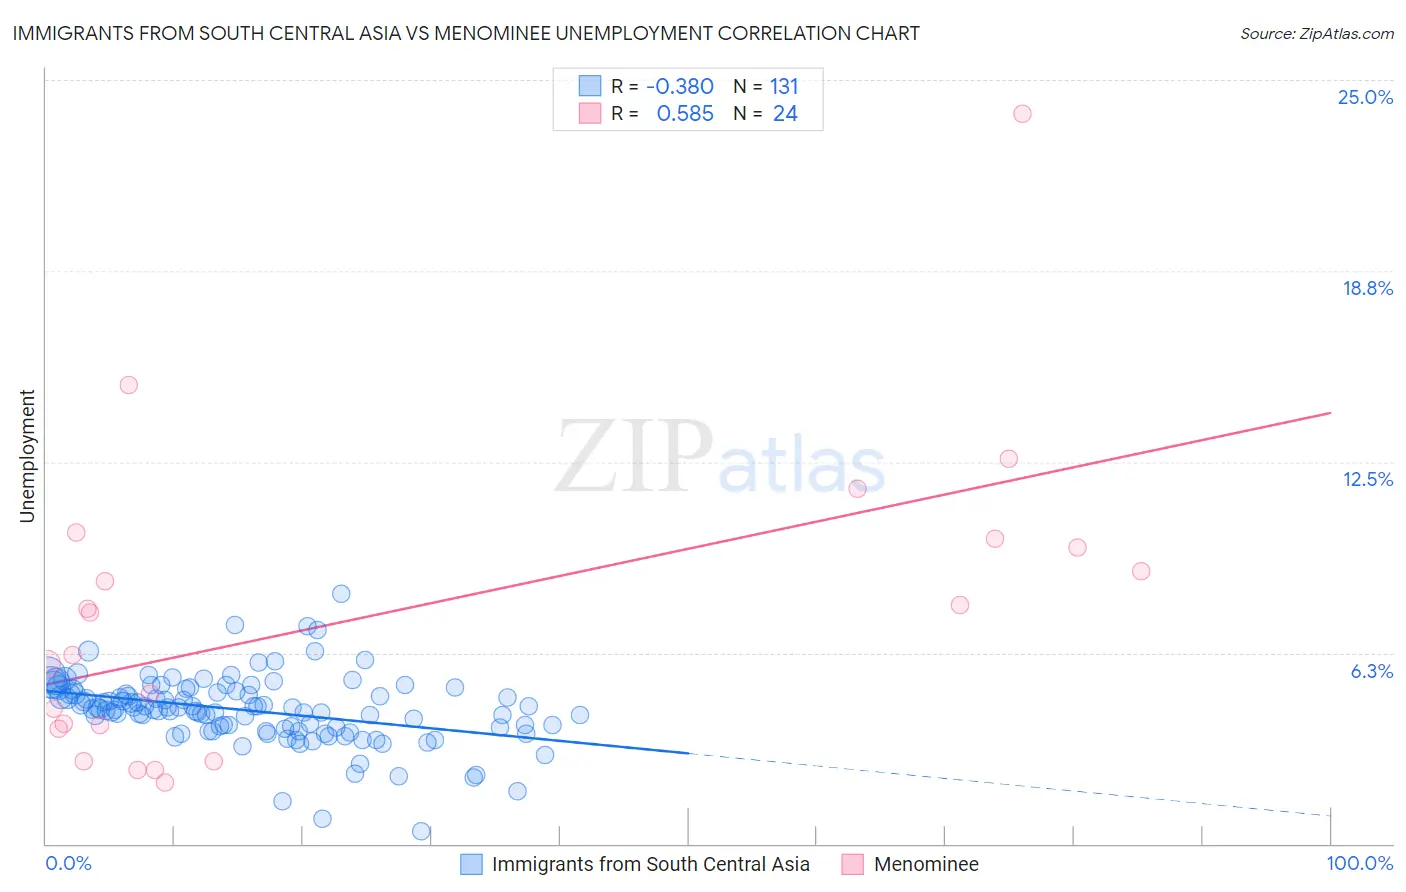
Immigrants from South Central Asia vs Menominee Unemployment Correlation Chart
The statistical analysis conducted on geographies consisting of 472,428,090 people shows a mild negative correlation between the proportion of Immigrants from South Central Asia and unemployment in the United States with a correlation coefficient (R) of -0.380 and weighted average of 4.9%. Similarly, the statistical analysis conducted on geographies consisting of 45,752,789 people shows a substantial positive correlation between the proportion of Menominee and unemployment in the United States with a correlation coefficient (R) of 0.585 and weighted average of 6.4%, a difference of 32.5%.
Unemployment Correlation Summary
| Measurement | Immigrants from South Central Asia | Menominee |
| Minimum | 0.40% | 2.0% |
| Maximum | 8.2% | 23.9% |
| Range | 7.8% | 21.9% |
| Mean | 4.4% | 7.4% |
| Median | 4.4% | 6.9% |
| Interquartile 25% (IQ1) | 3.8% | 3.8% |
| Interquartile 75% (IQ3) | 4.9% | 9.8% |
| Interquartile Range (IQR) | 1.2% | 6.0% |
| Standard Deviation (Sample) | 1.1% | 5.0% |
| Standard Deviation (Population) | 1.1% | 4.9% |
Similar Demographics by Unemployment
Demographics Similar to Immigrants from South Central Asia by Unemployment
In terms of unemployment, the demographic groups most similar to Immigrants from South Central Asia are Immigrants from Scotland (4.9%, a difference of 0.010%), French Canadian (4.9%, a difference of 0.020%), Immigrants from Belgium (4.9%, a difference of 0.18%), White/Caucasian (4.9%, a difference of 0.19%), and Immigrants from Taiwan (4.8%, a difference of 0.22%).
| Demographics | Rating | Rank | Unemployment |
| Filipinos | 99.5 /100 | #42 | Exceptional 4.8% |
| Yugoslavians | 99.5 /100 | #43 | Exceptional 4.8% |
| Austrians | 99.5 /100 | #44 | Exceptional 4.8% |
| French | 99.5 /100 | #45 | Exceptional 4.8% |
| Immigrants | Nepal | 99.4 /100 | #46 | Exceptional 4.8% |
| Immigrants | Taiwan | 99.4 /100 | #47 | Exceptional 4.8% |
| Immigrants | Scotland | 99.3 /100 | #48 | Exceptional 4.9% |
| Immigrants | South Central Asia | 99.3 /100 | #49 | Exceptional 4.9% |
| French Canadians | 99.3 /100 | #50 | Exceptional 4.9% |
| Immigrants | Belgium | 99.2 /100 | #51 | Exceptional 4.9% |
| Whites/Caucasians | 99.2 /100 | #52 | Exceptional 4.9% |
| Immigrants | Zimbabwe | 99.2 /100 | #53 | Exceptional 4.9% |
| Eastern Europeans | 99.2 /100 | #54 | Exceptional 4.9% |
| Australians | 99.2 /100 | #55 | Exceptional 4.9% |
| Celtics | 99.1 /100 | #56 | Exceptional 4.9% |
Demographics Similar to Menominee by Unemployment
In terms of unemployment, the demographic groups most similar to Menominee are Lumbee (6.4%, a difference of 0.030%), Immigrants from Jamaica (6.4%, a difference of 0.25%), Immigrants from Bangladesh (6.5%, a difference of 0.52%), Barbadian (6.5%, a difference of 0.89%), and Vietnamese (6.5%, a difference of 0.90%).
| Demographics | Rating | Rank | Unemployment |
| Immigrants | Haiti | 0.0 /100 | #298 | Tragic 6.3% |
| Immigrants | West Indies | 0.0 /100 | #299 | Tragic 6.3% |
| Immigrants | Trinidad and Tobago | 0.0 /100 | #300 | Tragic 6.3% |
| Trinidadians and Tobagonians | 0.0 /100 | #301 | Tragic 6.3% |
| West Indians | 0.0 /100 | #302 | Tragic 6.4% |
| Belizeans | 0.0 /100 | #303 | Tragic 6.4% |
| Immigrants | Jamaica | 0.0 /100 | #304 | Tragic 6.4% |
| Menominee | 0.0 /100 | #305 | Tragic 6.4% |
| Lumbee | 0.0 /100 | #306 | Tragic 6.4% |
| Immigrants | Bangladesh | 0.0 /100 | #307 | Tragic 6.5% |
| Barbadians | 0.0 /100 | #308 | Tragic 6.5% |
| Vietnamese | 0.0 /100 | #309 | Tragic 6.5% |
| Immigrants | Belize | 0.0 /100 | #310 | Tragic 6.5% |
| Cape Verdeans | 0.0 /100 | #311 | Tragic 6.5% |
| Colville | 0.0 /100 | #312 | Tragic 6.6% |