Immigrants from Uganda vs Menominee Unemployment
COMPARE
Immigrants from Uganda
Menominee
Unemployment
Unemployment Comparison
Immigrants from Uganda
Menominee
5.3%
UNEMPLOYMENT
37.8/ 100
METRIC RATING
186th/ 347
METRIC RANK
6.4%
UNEMPLOYMENT
0.0/ 100
METRIC RATING
305th/ 347
METRIC RANK
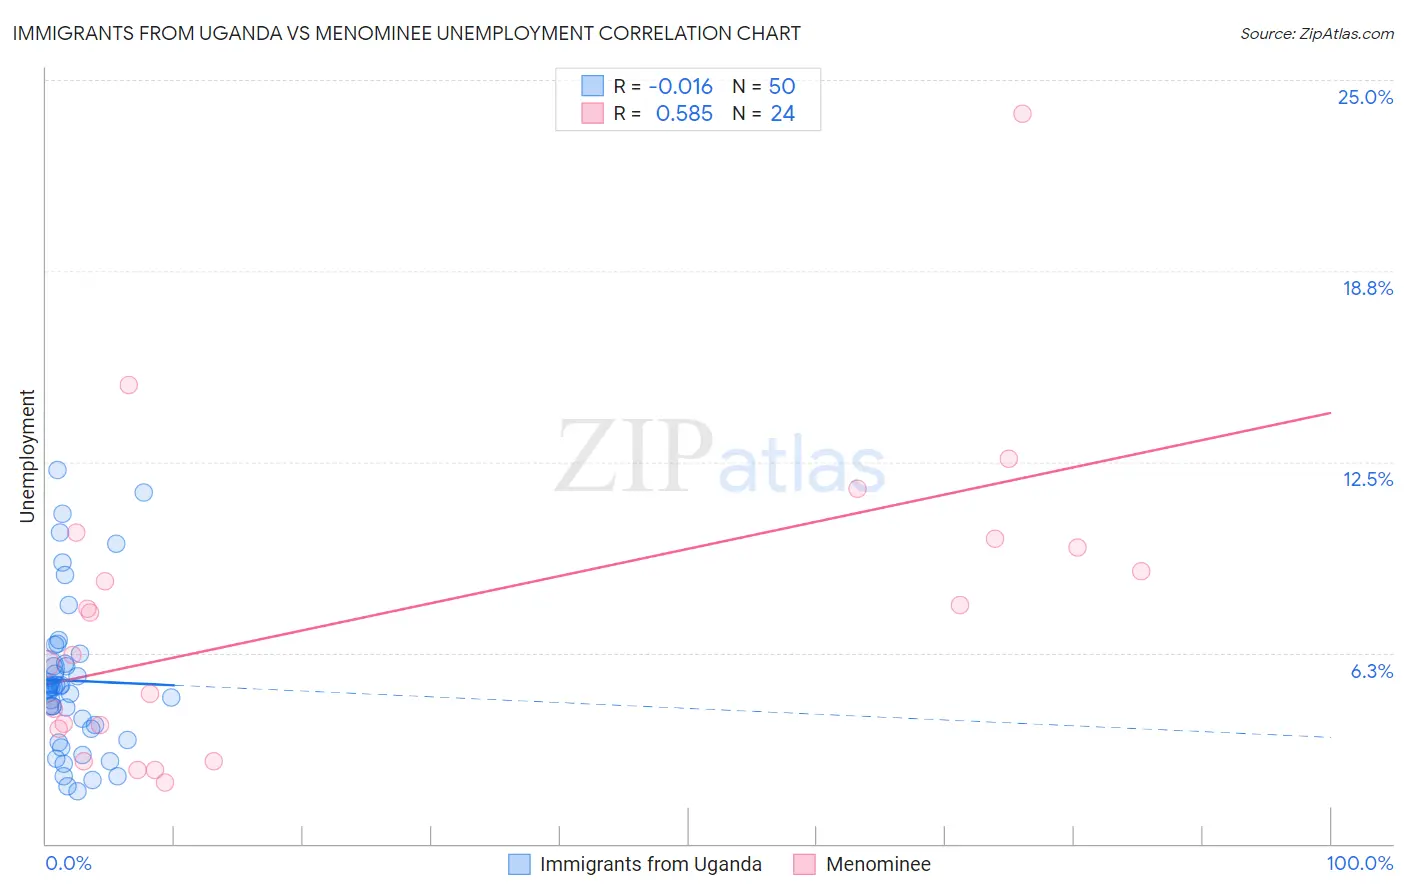
Immigrants from Uganda vs Menominee Unemployment Correlation Chart
The statistical analysis conducted on geographies consisting of 125,961,312 people shows no correlation between the proportion of Immigrants from Uganda and unemployment in the United States with a correlation coefficient (R) of -0.016 and weighted average of 5.3%. Similarly, the statistical analysis conducted on geographies consisting of 45,752,789 people shows a substantial positive correlation between the proportion of Menominee and unemployment in the United States with a correlation coefficient (R) of 0.585 and weighted average of 6.4%, a difference of 21.5%.
Unemployment Correlation Summary
| Measurement | Immigrants from Uganda | Menominee |
| Minimum | 1.7% | 2.0% |
| Maximum | 12.2% | 23.9% |
| Range | 10.5% | 21.9% |
| Mean | 5.3% | 7.4% |
| Median | 5.1% | 6.9% |
| Interquartile 25% (IQ1) | 3.7% | 3.8% |
| Interquartile 75% (IQ3) | 5.9% | 9.8% |
| Interquartile Range (IQR) | 2.2% | 6.0% |
| Standard Deviation (Sample) | 2.5% | 5.0% |
| Standard Deviation (Population) | 2.5% | 4.9% |
Similar Demographics by Unemployment
Demographics Similar to Immigrants from Uganda by Unemployment
In terms of unemployment, the demographic groups most similar to Immigrants from Uganda are Costa Rican (5.3%, a difference of 0.030%), Alsatian (5.3%, a difference of 0.050%), Immigrants from Thailand (5.3%, a difference of 0.070%), Assyrian/Chaldean/Syriac (5.3%, a difference of 0.090%), and Brazilian (5.3%, a difference of 0.15%).
| Demographics | Rating | Rank | Unemployment |
| Malaysians | 46.8 /100 | #179 | Average 5.3% |
| Immigrants | Greece | 45.0 /100 | #180 | Average 5.3% |
| Albanians | 43.5 /100 | #181 | Average 5.3% |
| Spaniards | 42.2 /100 | #182 | Average 5.3% |
| Brazilians | 40.2 /100 | #183 | Average 5.3% |
| Assyrians/Chaldeans/Syriacs | 39.2 /100 | #184 | Fair 5.3% |
| Immigrants | Thailand | 38.9 /100 | #185 | Fair 5.3% |
| Immigrants | Uganda | 37.8 /100 | #186 | Fair 5.3% |
| Costa Ricans | 37.4 /100 | #187 | Fair 5.3% |
| Alsatians | 37.0 /100 | #188 | Fair 5.3% |
| Immigrants | Belarus | 35.6 /100 | #189 | Fair 5.3% |
| Arabs | 35.3 /100 | #190 | Fair 5.3% |
| Somalis | 34.0 /100 | #191 | Fair 5.3% |
| South Americans | 33.9 /100 | #192 | Fair 5.3% |
| Immigrants | Somalia | 33.8 /100 | #193 | Fair 5.3% |
Demographics Similar to Menominee by Unemployment
In terms of unemployment, the demographic groups most similar to Menominee are Lumbee (6.4%, a difference of 0.030%), Immigrants from Jamaica (6.4%, a difference of 0.25%), Immigrants from Bangladesh (6.5%, a difference of 0.52%), Barbadian (6.5%, a difference of 0.89%), and Vietnamese (6.5%, a difference of 0.90%).
| Demographics | Rating | Rank | Unemployment |
| Immigrants | Haiti | 0.0 /100 | #298 | Tragic 6.3% |
| Immigrants | West Indies | 0.0 /100 | #299 | Tragic 6.3% |
| Immigrants | Trinidad and Tobago | 0.0 /100 | #300 | Tragic 6.3% |
| Trinidadians and Tobagonians | 0.0 /100 | #301 | Tragic 6.3% |
| West Indians | 0.0 /100 | #302 | Tragic 6.4% |
| Belizeans | 0.0 /100 | #303 | Tragic 6.4% |
| Immigrants | Jamaica | 0.0 /100 | #304 | Tragic 6.4% |
| Menominee | 0.0 /100 | #305 | Tragic 6.4% |
| Lumbee | 0.0 /100 | #306 | Tragic 6.4% |
| Immigrants | Bangladesh | 0.0 /100 | #307 | Tragic 6.5% |
| Barbadians | 0.0 /100 | #308 | Tragic 6.5% |
| Vietnamese | 0.0 /100 | #309 | Tragic 6.5% |
| Immigrants | Belize | 0.0 /100 | #310 | Tragic 6.5% |
| Cape Verdeans | 0.0 /100 | #311 | Tragic 6.5% |
| Colville | 0.0 /100 | #312 | Tragic 6.6% |