Menominee vs Slovene Male Unemployment
COMPARE
Menominee
Slovene
Male Unemployment
Male Unemployment Comparison
Menominee
Slovenes
6.0%
MALE UNEMPLOYMENT
0.0/ 100
METRIC RATING
275th/ 347
METRIC RANK
5.0%
MALE UNEMPLOYMENT
98.8/ 100
METRIC RATING
51st/ 347
METRIC RANK
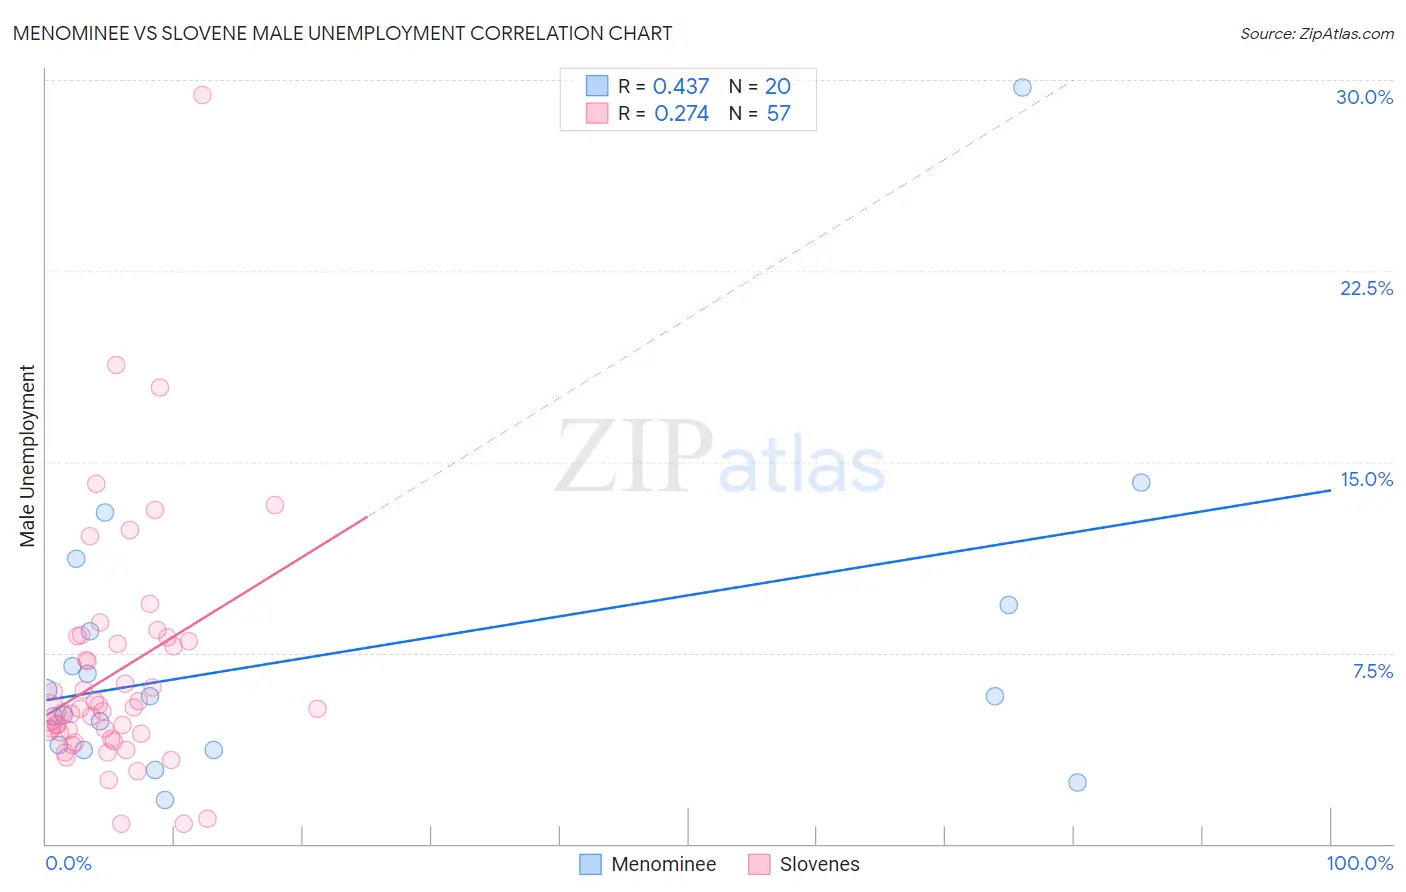
Menominee vs Slovene Male Unemployment Correlation Chart
The statistical analysis conducted on geographies consisting of 45,696,214 people shows a moderate positive correlation between the proportion of Menominee and unemployment rate among males in the United States with a correlation coefficient (R) of 0.437 and weighted average of 6.0%. Similarly, the statistical analysis conducted on geographies consisting of 260,529,032 people shows a weak positive correlation between the proportion of Slovenes and unemployment rate among males in the United States with a correlation coefficient (R) of 0.274 and weighted average of 5.0%, a difference of 21.7%.
Male Unemployment Correlation Summary
| Measurement | Menominee | Slovene |
| Minimum | 1.7% | 0.80% |
| Maximum | 29.7% | 29.4% |
| Range | 28.0% | 28.6% |
| Mean | 7.5% | 6.8% |
| Median | 5.8% | 5.3% |
| Interquartile 25% (IQ1) | 3.8% | 4.2% |
| Interquartile 75% (IQ3) | 8.9% | 8.0% |
| Interquartile Range (IQR) | 5.1% | 3.8% |
| Standard Deviation (Sample) | 6.2% | 4.8% |
| Standard Deviation (Population) | 6.1% | 4.8% |
Similar Demographics by Male Unemployment
Demographics Similar to Menominee by Male Unemployment
In terms of male unemployment, the demographic groups most similar to Menominee are Tlingit-Haida (6.0%, a difference of 0.10%), Immigrants from Sierra Leone (6.0%, a difference of 0.15%), Armenian (6.0%, a difference of 0.33%), Immigrants from Uzbekistan (6.0%, a difference of 0.34%), and Immigrants from Liberia (6.1%, a difference of 0.52%).
| Demographics | Rating | Rank | Male Unemployment |
| Bermudans | 0.0 /100 | #268 | Tragic 5.9% |
| Immigrants | Nigeria | 0.0 /100 | #269 | Tragic 6.0% |
| Sub-Saharan Africans | 0.0 /100 | #270 | Tragic 6.0% |
| Blackfeet | 0.0 /100 | #271 | Tragic 6.0% |
| Immigrants | Uzbekistan | 0.0 /100 | #272 | Tragic 6.0% |
| Armenians | 0.0 /100 | #273 | Tragic 6.0% |
| Immigrants | Sierra Leone | 0.0 /100 | #274 | Tragic 6.0% |
| Menominee | 0.0 /100 | #275 | Tragic 6.0% |
| Tlingit-Haida | 0.0 /100 | #276 | Tragic 6.0% |
| Immigrants | Liberia | 0.0 /100 | #277 | Tragic 6.1% |
| Immigrants | Fiji | 0.0 /100 | #278 | Tragic 6.1% |
| Ghanaians | 0.0 /100 | #279 | Tragic 6.1% |
| Immigrants | Ghana | 0.0 /100 | #280 | Tragic 6.2% |
| Sierra Leoneans | 0.0 /100 | #281 | Tragic 6.2% |
| Ecuadorians | 0.0 /100 | #282 | Tragic 6.2% |
Demographics Similar to Slovenes by Male Unemployment
In terms of male unemployment, the demographic groups most similar to Slovenes are Irish (5.0%, a difference of 0.020%), Polish (4.9%, a difference of 0.040%), Croatian (4.9%, a difference of 0.040%), Immigrants from Scotland (4.9%, a difference of 0.060%), and Austrian (4.9%, a difference of 0.070%).
| Demographics | Rating | Rank | Male Unemployment |
| Immigrants | Korea | 99.1 /100 | #44 | Exceptional 4.9% |
| Immigrants | Zimbabwe | 99.0 /100 | #45 | Exceptional 4.9% |
| Bhutanese | 98.9 /100 | #46 | Exceptional 4.9% |
| Austrians | 98.9 /100 | #47 | Exceptional 4.9% |
| Immigrants | Scotland | 98.9 /100 | #48 | Exceptional 4.9% |
| Poles | 98.9 /100 | #49 | Exceptional 4.9% |
| Croatians | 98.9 /100 | #50 | Exceptional 4.9% |
| Slovenes | 98.8 /100 | #51 | Exceptional 5.0% |
| Irish | 98.8 /100 | #52 | Exceptional 5.0% |
| Jordanians | 98.8 /100 | #53 | Exceptional 5.0% |
| Yugoslavians | 98.7 /100 | #54 | Exceptional 5.0% |
| Czechoslovakians | 98.7 /100 | #55 | Exceptional 5.0% |
| Immigrants | Bulgaria | 98.7 /100 | #56 | Exceptional 5.0% |
| Turks | 98.5 /100 | #57 | Exceptional 5.0% |
| Lithuanians | 98.5 /100 | #58 | Exceptional 5.0% |