Australian vs Immigrants from Greece Male Unemployment
COMPARE
Australian
Immigrants from Greece
Male Unemployment
Male Unemployment Comparison
Australians
Immigrants from Greece
5.0%
MALE UNEMPLOYMENT
97.4/ 100
METRIC RATING
68th/ 347
METRIC RANK
5.4%
MALE UNEMPLOYMENT
14.5/ 100
METRIC RATING
199th/ 347
METRIC RANK
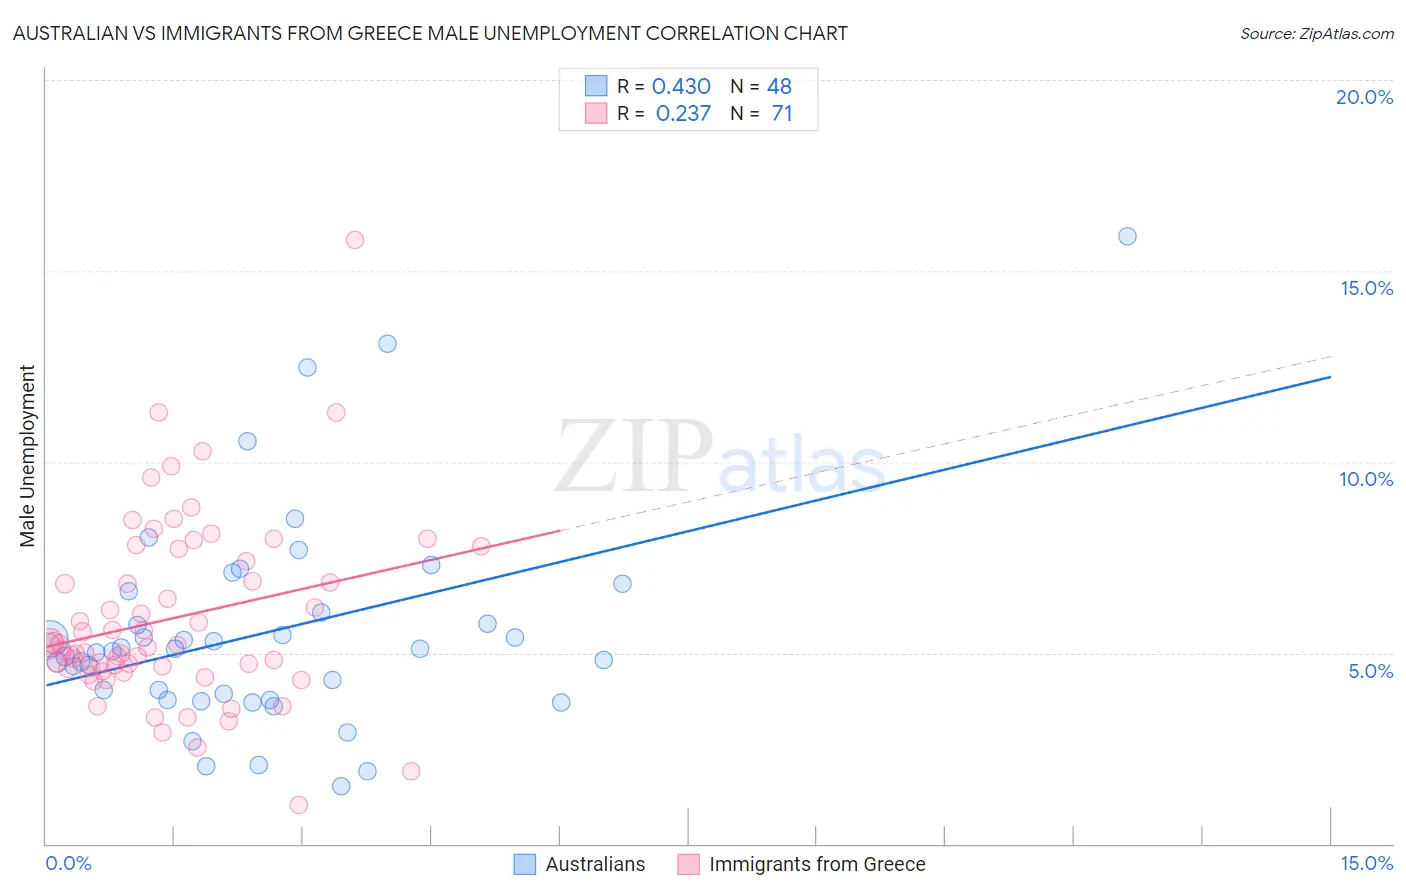
Australian vs Immigrants from Greece Male Unemployment Correlation Chart
The statistical analysis conducted on geographies consisting of 223,647,847 people shows a moderate positive correlation between the proportion of Australians and unemployment rate among males in the United States with a correlation coefficient (R) of 0.430 and weighted average of 5.0%. Similarly, the statistical analysis conducted on geographies consisting of 216,564,695 people shows a weak positive correlation between the proportion of Immigrants from Greece and unemployment rate among males in the United States with a correlation coefficient (R) of 0.237 and weighted average of 5.4%, a difference of 8.3%.
Male Unemployment Correlation Summary
| Measurement | Australian | Immigrants from Greece |
| Minimum | 1.5% | 1.0% |
| Maximum | 15.9% | 15.8% |
| Range | 14.4% | 14.8% |
| Mean | 5.6% | 5.9% |
| Median | 5.1% | 5.2% |
| Interquartile 25% (IQ1) | 3.8% | 4.6% |
| Interquartile 75% (IQ3) | 6.3% | 7.4% |
| Interquartile Range (IQR) | 2.5% | 2.8% |
| Standard Deviation (Sample) | 2.8% | 2.4% |
| Standard Deviation (Population) | 2.8% | 2.4% |
Similar Demographics by Male Unemployment
Demographics Similar to Australians by Male Unemployment
In terms of male unemployment, the demographic groups most similar to Australians are Immigrants from Canada (5.0%, a difference of 0.010%), Finnish (5.0%, a difference of 0.030%), Immigrants from Sweden (5.0%, a difference of 0.030%), White/Caucasian (5.0%, a difference of 0.080%), and New Zealander (5.0%, a difference of 0.10%).
| Demographics | Rating | Rank | Male Unemployment |
| Cambodians | 98.1 /100 | #61 | Exceptional 5.0% |
| Basques | 97.9 /100 | #62 | Exceptional 5.0% |
| Eastern Europeans | 97.9 /100 | #63 | Exceptional 5.0% |
| Celtics | 97.8 /100 | #64 | Exceptional 5.0% |
| Icelanders | 97.6 /100 | #65 | Exceptional 5.0% |
| Finns | 97.5 /100 | #66 | Exceptional 5.0% |
| Immigrants | Canada | 97.5 /100 | #67 | Exceptional 5.0% |
| Australians | 97.4 /100 | #68 | Exceptional 5.0% |
| Immigrants | Sweden | 97.4 /100 | #69 | Exceptional 5.0% |
| Whites/Caucasians | 97.3 /100 | #70 | Exceptional 5.0% |
| New Zealanders | 97.3 /100 | #71 | Exceptional 5.0% |
| Immigrants | South Africa | 97.1 /100 | #72 | Exceptional 5.0% |
| Greeks | 97.0 /100 | #73 | Exceptional 5.0% |
| Immigrants | North America | 96.9 /100 | #74 | Exceptional 5.0% |
| Assyrians/Chaldeans/Syriacs | 96.9 /100 | #75 | Exceptional 5.0% |
Demographics Similar to Immigrants from Greece by Male Unemployment
In terms of male unemployment, the demographic groups most similar to Immigrants from Greece are Immigrants from Thailand (5.4%, a difference of 0.020%), Immigrants from Zaire (5.4%, a difference of 0.10%), Immigrants from Philippines (5.4%, a difference of 0.12%), Nonimmigrants (5.4%, a difference of 0.16%), and Immigrants from Laos (5.4%, a difference of 0.18%).
| Demographics | Rating | Rank | Male Unemployment |
| Immigrants | Belarus | 26.0 /100 | #192 | Fair 5.4% |
| Immigrants | Israel | 25.2 /100 | #193 | Fair 5.4% |
| Spanish | 19.7 /100 | #194 | Poor 5.4% |
| Immigrants | Southern Europe | 17.7 /100 | #195 | Poor 5.4% |
| Albanians | 17.3 /100 | #196 | Poor 5.4% |
| Alsatians | 16.7 /100 | #197 | Poor 5.4% |
| Immigrants | Thailand | 14.7 /100 | #198 | Poor 5.4% |
| Immigrants | Greece | 14.5 /100 | #199 | Poor 5.4% |
| Immigrants | Zaire | 13.7 /100 | #200 | Poor 5.4% |
| Immigrants | Philippines | 13.5 /100 | #201 | Poor 5.4% |
| Immigrants | Nonimmigrants | 13.1 /100 | #202 | Poor 5.4% |
| Immigrants | Laos | 13.0 /100 | #203 | Poor 5.4% |
| Guamanians/Chamorros | 12.3 /100 | #204 | Poor 5.4% |
| Immigrants | Costa Rica | 11.4 /100 | #205 | Poor 5.5% |
| Immigrants | Ukraine | 9.9 /100 | #206 | Tragic 5.5% |