Marshallese vs Immigrants from Uruguay Unemployment
COMPARE
Marshallese
Immigrants from Uruguay
Unemployment
Unemployment Comparison
Marshallese
Immigrants from Uruguay
5.6%
UNEMPLOYMENT
1.3/ 100
METRIC RATING
243rd/ 347
METRIC RANK
5.3%
UNEMPLOYMENT
29.8/ 100
METRIC RATING
197th/ 347
METRIC RANK
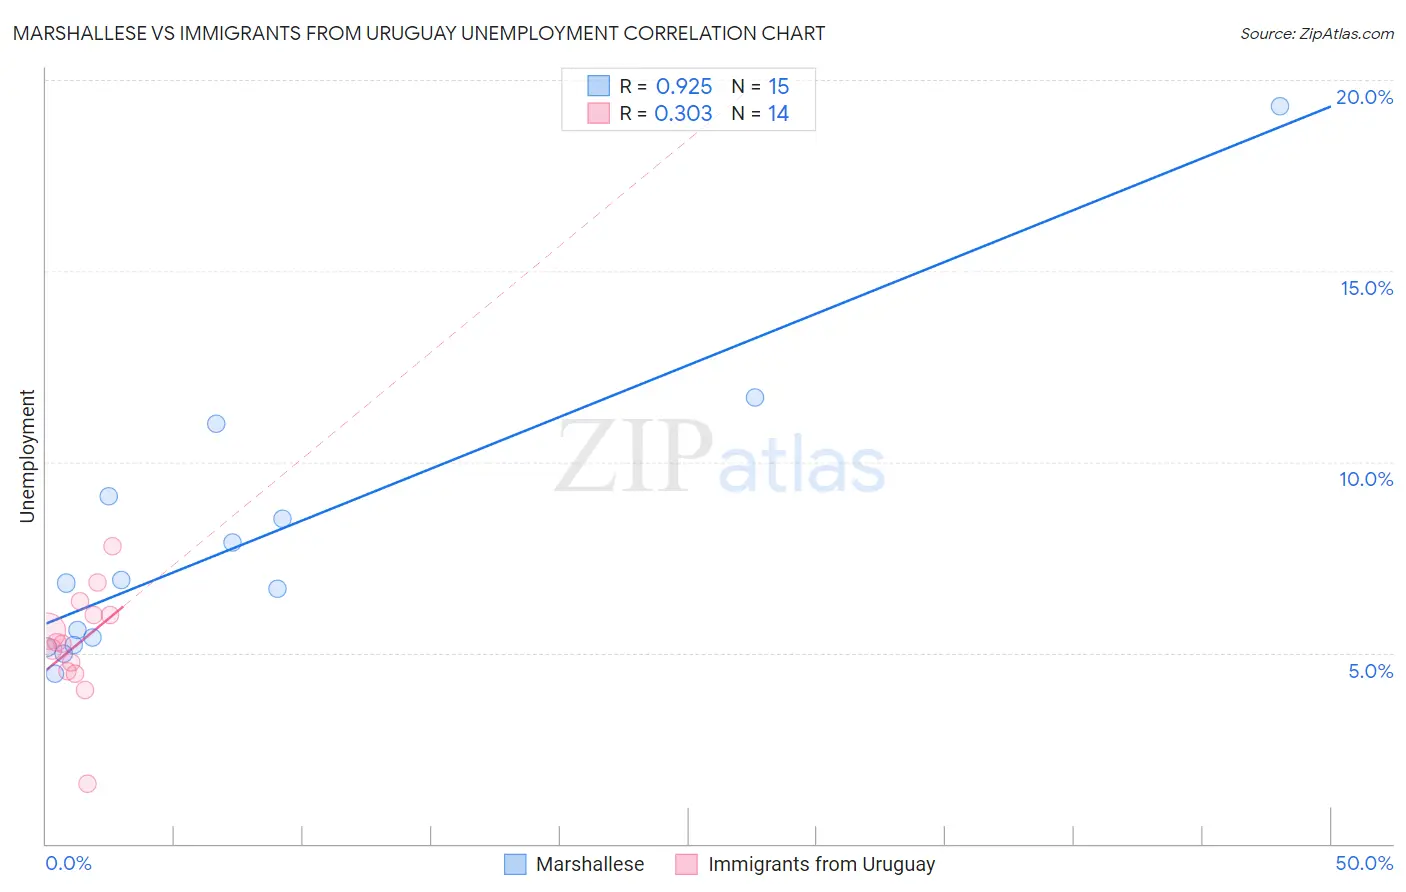
Marshallese vs Immigrants from Uruguay Unemployment Correlation Chart
The statistical analysis conducted on geographies consisting of 14,759,035 people shows a near-perfect positive correlation between the proportion of Marshallese and unemployment in the United States with a correlation coefficient (R) of 0.925 and weighted average of 5.6%. Similarly, the statistical analysis conducted on geographies consisting of 133,243,021 people shows a mild positive correlation between the proportion of Immigrants from Uruguay and unemployment in the United States with a correlation coefficient (R) of 0.303 and weighted average of 5.3%, a difference of 5.2%.
Unemployment Correlation Summary
| Measurement | Marshallese | Immigrants from Uruguay |
| Minimum | 4.5% | 1.6% |
| Maximum | 19.3% | 7.8% |
| Range | 14.8% | 6.2% |
| Mean | 7.9% | 5.2% |
| Median | 6.8% | 5.3% |
| Interquartile 25% (IQ1) | 5.2% | 4.5% |
| Interquartile 75% (IQ3) | 9.1% | 6.0% |
| Interquartile Range (IQR) | 3.9% | 1.5% |
| Standard Deviation (Sample) | 3.8% | 1.5% |
| Standard Deviation (Population) | 3.7% | 1.4% |
Similar Demographics by Unemployment
Demographics Similar to Marshallese by Unemployment
In terms of unemployment, the demographic groups most similar to Marshallese are Dutch West Indian (5.6%, a difference of 0.15%), French American Indian (5.6%, a difference of 0.17%), Bermudan (5.6%, a difference of 0.22%), Immigrants from Cameroon (5.6%, a difference of 0.36%), and Liberian (5.6%, a difference of 0.49%).
| Demographics | Rating | Rank | Unemployment |
| Immigrants | Cambodia | 3.3 /100 | #236 | Tragic 5.5% |
| Moroccans | 3.2 /100 | #237 | Tragic 5.5% |
| Immigrants | Western Asia | 2.8 /100 | #238 | Tragic 5.5% |
| Immigrants | Immigrants | 2.6 /100 | #239 | Tragic 5.5% |
| Cree | 2.6 /100 | #240 | Tragic 5.6% |
| Tlingit-Haida | 2.0 /100 | #241 | Tragic 5.6% |
| Spanish Americans | 2.0 /100 | #242 | Tragic 5.6% |
| Marshallese | 1.3 /100 | #243 | Tragic 5.6% |
| Dutch West Indians | 1.2 /100 | #244 | Tragic 5.6% |
| French American Indians | 1.2 /100 | #245 | Tragic 5.6% |
| Bermudans | 1.1 /100 | #246 | Tragic 5.6% |
| Immigrants | Cameroon | 1.0 /100 | #247 | Tragic 5.6% |
| Liberians | 0.9 /100 | #248 | Tragic 5.6% |
| Cajuns | 0.8 /100 | #249 | Tragic 5.6% |
| Japanese | 0.8 /100 | #250 | Tragic 5.6% |
Demographics Similar to Immigrants from Uruguay by Unemployment
In terms of unemployment, the demographic groups most similar to Immigrants from Uruguay are Peruvian (5.3%, a difference of 0.010%), Immigrants from Laos (5.3%, a difference of 0.080%), Immigrants from Southern Europe (5.3%, a difference of 0.080%), Immigrants from Israel (5.3%, a difference of 0.090%), and Immigrants from Afghanistan (5.3%, a difference of 0.090%).
| Demographics | Rating | Rank | Unemployment |
| Arabs | 35.3 /100 | #190 | Fair 5.3% |
| Somalis | 34.0 /100 | #191 | Fair 5.3% |
| South Americans | 33.9 /100 | #192 | Fair 5.3% |
| Immigrants | Somalia | 33.8 /100 | #193 | Fair 5.3% |
| Immigrants | Laos | 30.9 /100 | #194 | Fair 5.3% |
| Immigrants | Southern Europe | 30.9 /100 | #195 | Fair 5.3% |
| Peruvians | 29.9 /100 | #196 | Fair 5.3% |
| Immigrants | Uruguay | 29.8 /100 | #197 | Fair 5.3% |
| Immigrants | Israel | 28.6 /100 | #198 | Fair 5.3% |
| Immigrants | Afghanistan | 28.6 /100 | #199 | Fair 5.3% |
| Koreans | 27.4 /100 | #200 | Fair 5.3% |
| Immigrants | South Eastern Asia | 27.0 /100 | #201 | Fair 5.3% |
| Cherokee | 25.5 /100 | #202 | Fair 5.3% |
| Immigrants | Micronesia | 25.2 /100 | #203 | Fair 5.3% |
| Immigrants | Ukraine | 24.9 /100 | #204 | Fair 5.3% |