Marshallese vs Navajo Unemployment
COMPARE
Marshallese
Navajo
Unemployment
Unemployment Comparison
Marshallese
Navajo
5.6%
UNEMPLOYMENT
1.3/ 100
METRIC RATING
243rd/ 347
METRIC RANK
8.4%
UNEMPLOYMENT
0.0/ 100
METRIC RATING
339th/ 347
METRIC RANK
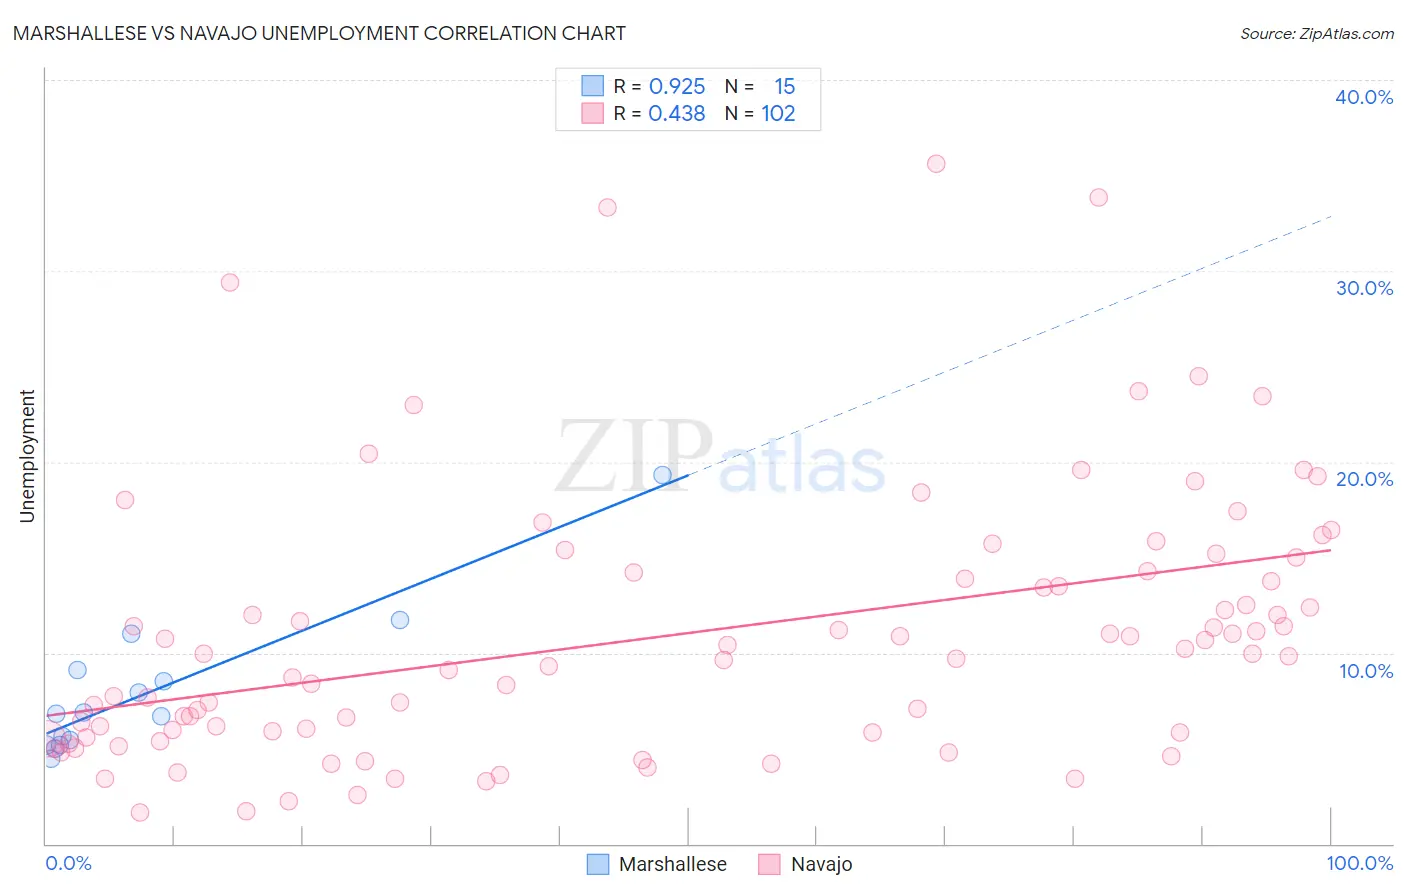
Marshallese vs Navajo Unemployment Correlation Chart
The statistical analysis conducted on geographies consisting of 14,759,035 people shows a near-perfect positive correlation between the proportion of Marshallese and unemployment in the United States with a correlation coefficient (R) of 0.925 and weighted average of 5.6%. Similarly, the statistical analysis conducted on geographies consisting of 224,594,128 people shows a moderate positive correlation between the proportion of Navajo and unemployment in the United States with a correlation coefficient (R) of 0.438 and weighted average of 8.4%, a difference of 49.0%.
Unemployment Correlation Summary
| Measurement | Marshallese | Navajo |
| Minimum | 4.5% | 1.6% |
| Maximum | 19.3% | 35.6% |
| Range | 14.8% | 34.0% |
| Mean | 7.9% | 10.9% |
| Median | 6.8% | 9.9% |
| Interquartile 25% (IQ1) | 5.2% | 5.8% |
| Interquartile 75% (IQ3) | 9.1% | 14.2% |
| Interquartile Range (IQR) | 3.9% | 8.4% |
| Standard Deviation (Sample) | 3.8% | 7.0% |
| Standard Deviation (Population) | 3.7% | 7.0% |
Similar Demographics by Unemployment
Demographics Similar to Marshallese by Unemployment
In terms of unemployment, the demographic groups most similar to Marshallese are Dutch West Indian (5.6%, a difference of 0.15%), French American Indian (5.6%, a difference of 0.17%), Bermudan (5.6%, a difference of 0.22%), Immigrants from Cameroon (5.6%, a difference of 0.36%), and Liberian (5.6%, a difference of 0.49%).
| Demographics | Rating | Rank | Unemployment |
| Immigrants | Cambodia | 3.3 /100 | #236 | Tragic 5.5% |
| Moroccans | 3.2 /100 | #237 | Tragic 5.5% |
| Immigrants | Western Asia | 2.8 /100 | #238 | Tragic 5.5% |
| Immigrants | Immigrants | 2.6 /100 | #239 | Tragic 5.5% |
| Cree | 2.6 /100 | #240 | Tragic 5.6% |
| Tlingit-Haida | 2.0 /100 | #241 | Tragic 5.6% |
| Spanish Americans | 2.0 /100 | #242 | Tragic 5.6% |
| Marshallese | 1.3 /100 | #243 | Tragic 5.6% |
| Dutch West Indians | 1.2 /100 | #244 | Tragic 5.6% |
| French American Indians | 1.2 /100 | #245 | Tragic 5.6% |
| Bermudans | 1.1 /100 | #246 | Tragic 5.6% |
| Immigrants | Cameroon | 1.0 /100 | #247 | Tragic 5.6% |
| Liberians | 0.9 /100 | #248 | Tragic 5.6% |
| Cajuns | 0.8 /100 | #249 | Tragic 5.6% |
| Japanese | 0.8 /100 | #250 | Tragic 5.6% |
Demographics Similar to Navajo by Unemployment
In terms of unemployment, the demographic groups most similar to Navajo are Puerto Rican (8.4%, a difference of 0.79%), Pima (8.2%, a difference of 1.6%), Cheyenne (8.0%, a difference of 4.4%), Tohono O'odham (8.9%, a difference of 6.3%), and Hopi (8.9%, a difference of 6.7%).
| Demographics | Rating | Rank | Unemployment |
| Sioux | 0.0 /100 | #332 | Tragic 7.4% |
| Immigrants | Dominican Republic | 0.0 /100 | #333 | Tragic 7.4% |
| Apache | 0.0 /100 | #334 | Tragic 7.4% |
| Alaskan Athabascans | 0.0 /100 | #335 | Tragic 7.7% |
| Immigrants | Yemen | 0.0 /100 | #336 | Tragic 7.7% |
| Cheyenne | 0.0 /100 | #337 | Tragic 8.0% |
| Pima | 0.0 /100 | #338 | Tragic 8.2% |
| Navajo | 0.0 /100 | #339 | Tragic 8.4% |
| Puerto Ricans | 0.0 /100 | #340 | Tragic 8.4% |
| Tohono O'odham | 0.0 /100 | #341 | Tragic 8.9% |
| Hopi | 0.0 /100 | #342 | Tragic 8.9% |
| Yuman | 0.0 /100 | #343 | Tragic 9.1% |
| Arapaho | 0.0 /100 | #344 | Tragic 9.8% |
| Inupiat | 0.0 /100 | #345 | Tragic 10.1% |
| Crow | 0.0 /100 | #346 | Tragic 11.1% |