Macedonian vs Senegalese Unemployment
COMPARE
Macedonian
Senegalese
Unemployment
Unemployment Comparison
Macedonians
Senegalese
5.1%
UNEMPLOYMENT
89.7/ 100
METRIC RATING
120th/ 347
METRIC RANK
6.2%
UNEMPLOYMENT
0.0/ 100
METRIC RATING
290th/ 347
METRIC RANK
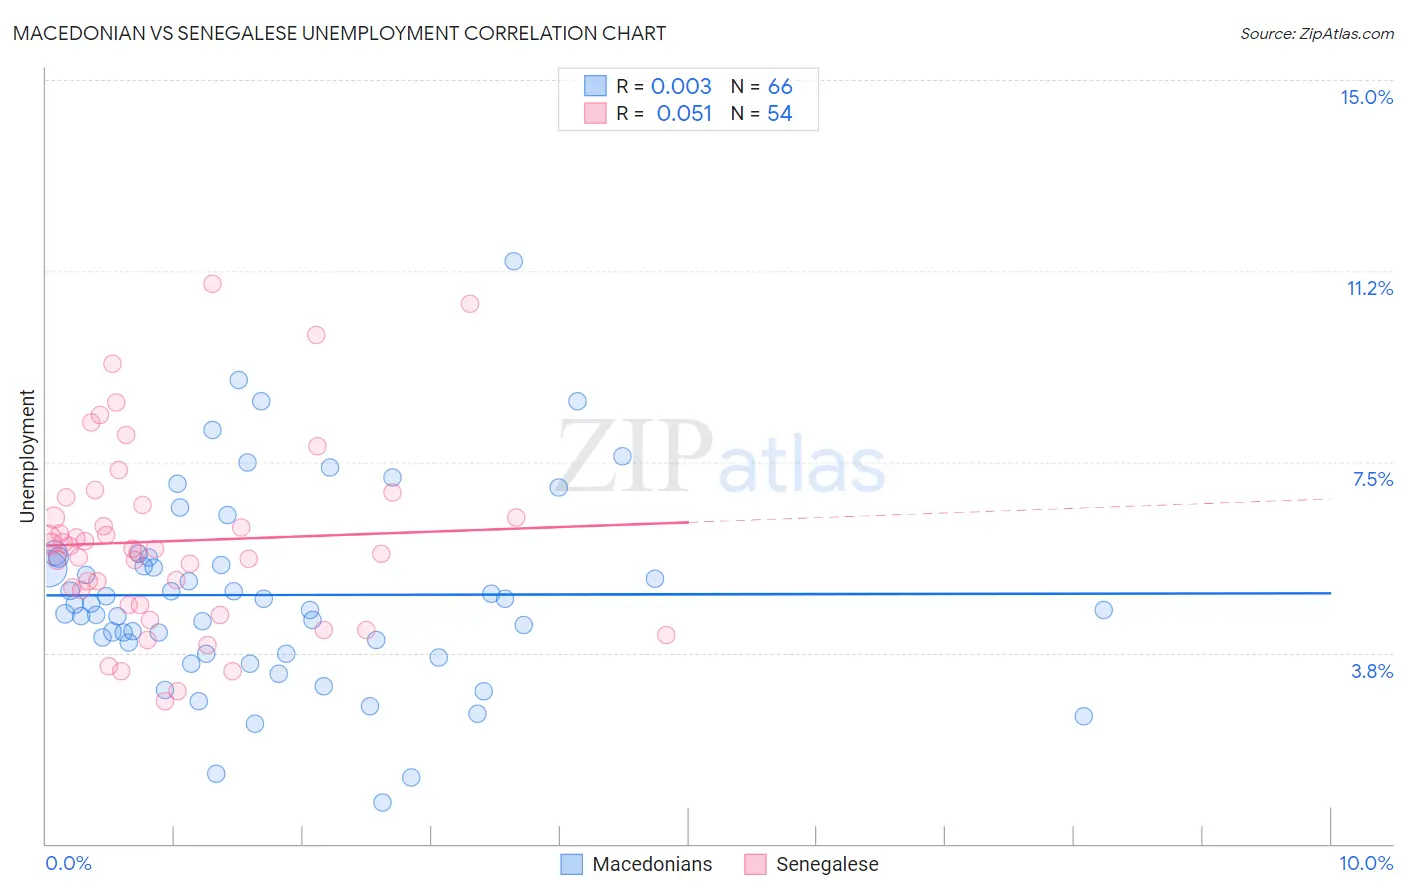
Macedonian vs Senegalese Unemployment Correlation Chart
The statistical analysis conducted on geographies consisting of 132,628,728 people shows no correlation between the proportion of Macedonians and unemployment in the United States with a correlation coefficient (R) of 0.003 and weighted average of 5.1%. Similarly, the statistical analysis conducted on geographies consisting of 78,136,746 people shows a slight positive correlation between the proportion of Senegalese and unemployment in the United States with a correlation coefficient (R) of 0.051 and weighted average of 6.2%, a difference of 22.0%.
Unemployment Correlation Summary
| Measurement | Macedonian | Senegalese |
| Minimum | 0.80% | 2.8% |
| Maximum | 11.4% | 11.0% |
| Range | 10.6% | 8.2% |
| Mean | 4.9% | 5.9% |
| Median | 4.7% | 5.8% |
| Interquartile 25% (IQ1) | 3.7% | 4.7% |
| Interquartile 75% (IQ3) | 5.6% | 6.7% |
| Interquartile Range (IQR) | 1.9% | 2.0% |
| Standard Deviation (Sample) | 1.9% | 1.8% |
| Standard Deviation (Population) | 1.9% | 1.8% |
Similar Demographics by Unemployment
Demographics Similar to Macedonians by Unemployment
In terms of unemployment, the demographic groups most similar to Macedonians are Immigrants from France (5.1%, a difference of 0.010%), Lebanese (5.1%, a difference of 0.070%), Immigrants from Switzerland (5.1%, a difference of 0.090%), Asian (5.1%, a difference of 0.11%), and Ethiopian (5.1%, a difference of 0.17%).
| Demographics | Rating | Rank | Unemployment |
| Argentineans | 92.4 /100 | #113 | Exceptional 5.1% |
| Immigrants | Ireland | 92.1 /100 | #114 | Exceptional 5.1% |
| Immigrants | Western Europe | 91.1 /100 | #115 | Exceptional 5.1% |
| Immigrants | Sri Lanka | 91.1 /100 | #116 | Exceptional 5.1% |
| Immigrants | Malaysia | 91.0 /100 | #117 | Exceptional 5.1% |
| Immigrants | Germany | 90.8 /100 | #118 | Exceptional 5.1% |
| Immigrants | France | 89.7 /100 | #119 | Excellent 5.1% |
| Macedonians | 89.7 /100 | #120 | Excellent 5.1% |
| Lebanese | 89.2 /100 | #121 | Excellent 5.1% |
| Immigrants | Switzerland | 89.1 /100 | #122 | Excellent 5.1% |
| Asians | 89.0 /100 | #123 | Excellent 5.1% |
| Ethiopians | 88.6 /100 | #124 | Excellent 5.1% |
| Immigrants | Eastern Asia | 88.3 /100 | #125 | Excellent 5.1% |
| Kenyans | 88.2 /100 | #126 | Excellent 5.1% |
| Immigrants | Kenya | 88.2 /100 | #127 | Excellent 5.1% |
Demographics Similar to Senegalese by Unemployment
In terms of unemployment, the demographic groups most similar to Senegalese are Chippewa (6.2%, a difference of 0.090%), Ecuadorian (6.2%, a difference of 0.44%), Nepalese (6.2%, a difference of 0.47%), Haitian (6.2%, a difference of 0.53%), and Central American Indian (6.2%, a difference of 0.54%).
| Demographics | Rating | Rank | Unemployment |
| Immigrants | Ghana | 0.0 /100 | #283 | Tragic 6.1% |
| Aleuts | 0.0 /100 | #284 | Tragic 6.1% |
| Immigrants | Senegal | 0.0 /100 | #285 | Tragic 6.1% |
| Immigrants | Caribbean | 0.0 /100 | #286 | Tragic 6.2% |
| Nepalese | 0.0 /100 | #287 | Tragic 6.2% |
| Ecuadorians | 0.0 /100 | #288 | Tragic 6.2% |
| Chippewa | 0.0 /100 | #289 | Tragic 6.2% |
| Senegalese | 0.0 /100 | #290 | Tragic 6.2% |
| Haitians | 0.0 /100 | #291 | Tragic 6.2% |
| Central American Indians | 0.0 /100 | #292 | Tragic 6.2% |
| Immigrants | Ecuador | 0.0 /100 | #293 | Tragic 6.2% |
| Spanish American Indians | 0.0 /100 | #294 | Tragic 6.2% |
| U.S. Virgin Islanders | 0.0 /100 | #295 | Tragic 6.3% |
| Ute | 0.0 /100 | #296 | Tragic 6.3% |
| Jamaicans | 0.0 /100 | #297 | Tragic 6.3% |