Cape Verdean vs Senegalese Unemployment
COMPARE
Cape Verdean
Senegalese
Unemployment
Unemployment Comparison
Cape Verdeans
Senegalese
6.5%
UNEMPLOYMENT
0.0/ 100
METRIC RATING
311th/ 347
METRIC RANK
6.2%
UNEMPLOYMENT
0.0/ 100
METRIC RATING
290th/ 347
METRIC RANK
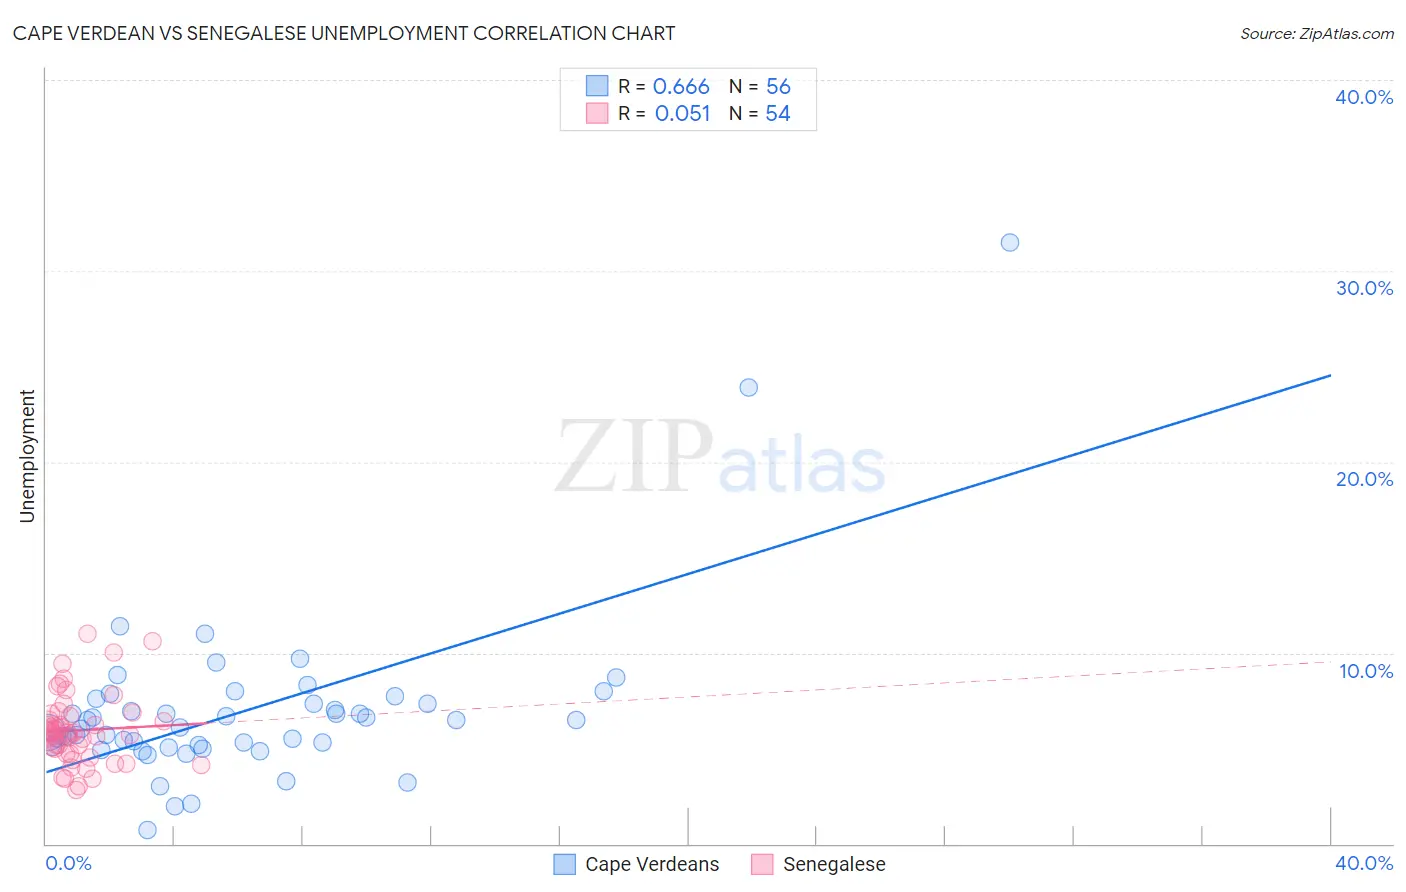
Cape Verdean vs Senegalese Unemployment Correlation Chart
The statistical analysis conducted on geographies consisting of 107,538,461 people shows a significant positive correlation between the proportion of Cape Verdeans and unemployment in the United States with a correlation coefficient (R) of 0.666 and weighted average of 6.5%. Similarly, the statistical analysis conducted on geographies consisting of 78,136,746 people shows a slight positive correlation between the proportion of Senegalese and unemployment in the United States with a correlation coefficient (R) of 0.051 and weighted average of 6.2%, a difference of 5.3%.
Unemployment Correlation Summary
| Measurement | Cape Verdean | Senegalese |
| Minimum | 0.70% | 2.8% |
| Maximum | 31.5% | 11.0% |
| Range | 30.8% | 8.2% |
| Mean | 6.9% | 5.9% |
| Median | 6.3% | 5.8% |
| Interquartile 25% (IQ1) | 5.1% | 4.7% |
| Interquartile 75% (IQ3) | 7.5% | 6.7% |
| Interquartile Range (IQR) | 2.3% | 2.0% |
| Standard Deviation (Sample) | 4.6% | 1.8% |
| Standard Deviation (Population) | 4.5% | 1.8% |
Similar Demographics by Unemployment
Demographics Similar to Cape Verdeans by Unemployment
In terms of unemployment, the demographic groups most similar to Cape Verdeans are Immigrants from Belize (6.5%, a difference of 0.33%), Colville (6.6%, a difference of 0.57%), Vietnamese (6.5%, a difference of 0.60%), Barbadian (6.5%, a difference of 0.61%), and Immigrants from Barbados (6.6%, a difference of 0.95%).
| Demographics | Rating | Rank | Unemployment |
| Immigrants | Jamaica | 0.0 /100 | #304 | Tragic 6.4% |
| Menominee | 0.0 /100 | #305 | Tragic 6.4% |
| Lumbee | 0.0 /100 | #306 | Tragic 6.4% |
| Immigrants | Bangladesh | 0.0 /100 | #307 | Tragic 6.5% |
| Barbadians | 0.0 /100 | #308 | Tragic 6.5% |
| Vietnamese | 0.0 /100 | #309 | Tragic 6.5% |
| Immigrants | Belize | 0.0 /100 | #310 | Tragic 6.5% |
| Cape Verdeans | 0.0 /100 | #311 | Tragic 6.5% |
| Colville | 0.0 /100 | #312 | Tragic 6.6% |
| Immigrants | Barbados | 0.0 /100 | #313 | Tragic 6.6% |
| Blacks/African Americans | 0.0 /100 | #314 | Tragic 6.6% |
| Houma | 0.0 /100 | #315 | Tragic 6.7% |
| Immigrants | Dominica | 0.0 /100 | #316 | Tragic 6.7% |
| Shoshone | 0.0 /100 | #317 | Tragic 6.8% |
| Immigrants | Cabo Verde | 0.0 /100 | #318 | Tragic 6.8% |
Demographics Similar to Senegalese by Unemployment
In terms of unemployment, the demographic groups most similar to Senegalese are Chippewa (6.2%, a difference of 0.090%), Ecuadorian (6.2%, a difference of 0.44%), Nepalese (6.2%, a difference of 0.47%), Haitian (6.2%, a difference of 0.53%), and Central American Indian (6.2%, a difference of 0.54%).
| Demographics | Rating | Rank | Unemployment |
| Immigrants | Ghana | 0.0 /100 | #283 | Tragic 6.1% |
| Aleuts | 0.0 /100 | #284 | Tragic 6.1% |
| Immigrants | Senegal | 0.0 /100 | #285 | Tragic 6.1% |
| Immigrants | Caribbean | 0.0 /100 | #286 | Tragic 6.2% |
| Nepalese | 0.0 /100 | #287 | Tragic 6.2% |
| Ecuadorians | 0.0 /100 | #288 | Tragic 6.2% |
| Chippewa | 0.0 /100 | #289 | Tragic 6.2% |
| Senegalese | 0.0 /100 | #290 | Tragic 6.2% |
| Haitians | 0.0 /100 | #291 | Tragic 6.2% |
| Central American Indians | 0.0 /100 | #292 | Tragic 6.2% |
| Immigrants | Ecuador | 0.0 /100 | #293 | Tragic 6.2% |
| Spanish American Indians | 0.0 /100 | #294 | Tragic 6.2% |
| U.S. Virgin Islanders | 0.0 /100 | #295 | Tragic 6.3% |
| Ute | 0.0 /100 | #296 | Tragic 6.3% |
| Jamaicans | 0.0 /100 | #297 | Tragic 6.3% |