Immigrants from Czechoslovakia vs Senegalese Unemployment
COMPARE
Immigrants from Czechoslovakia
Senegalese
Unemployment
Unemployment Comparison
Immigrants from Czechoslovakia
Senegalese
5.0%
UNEMPLOYMENT
95.1/ 100
METRIC RATING
97th/ 347
METRIC RANK
6.2%
UNEMPLOYMENT
0.0/ 100
METRIC RATING
290th/ 347
METRIC RANK
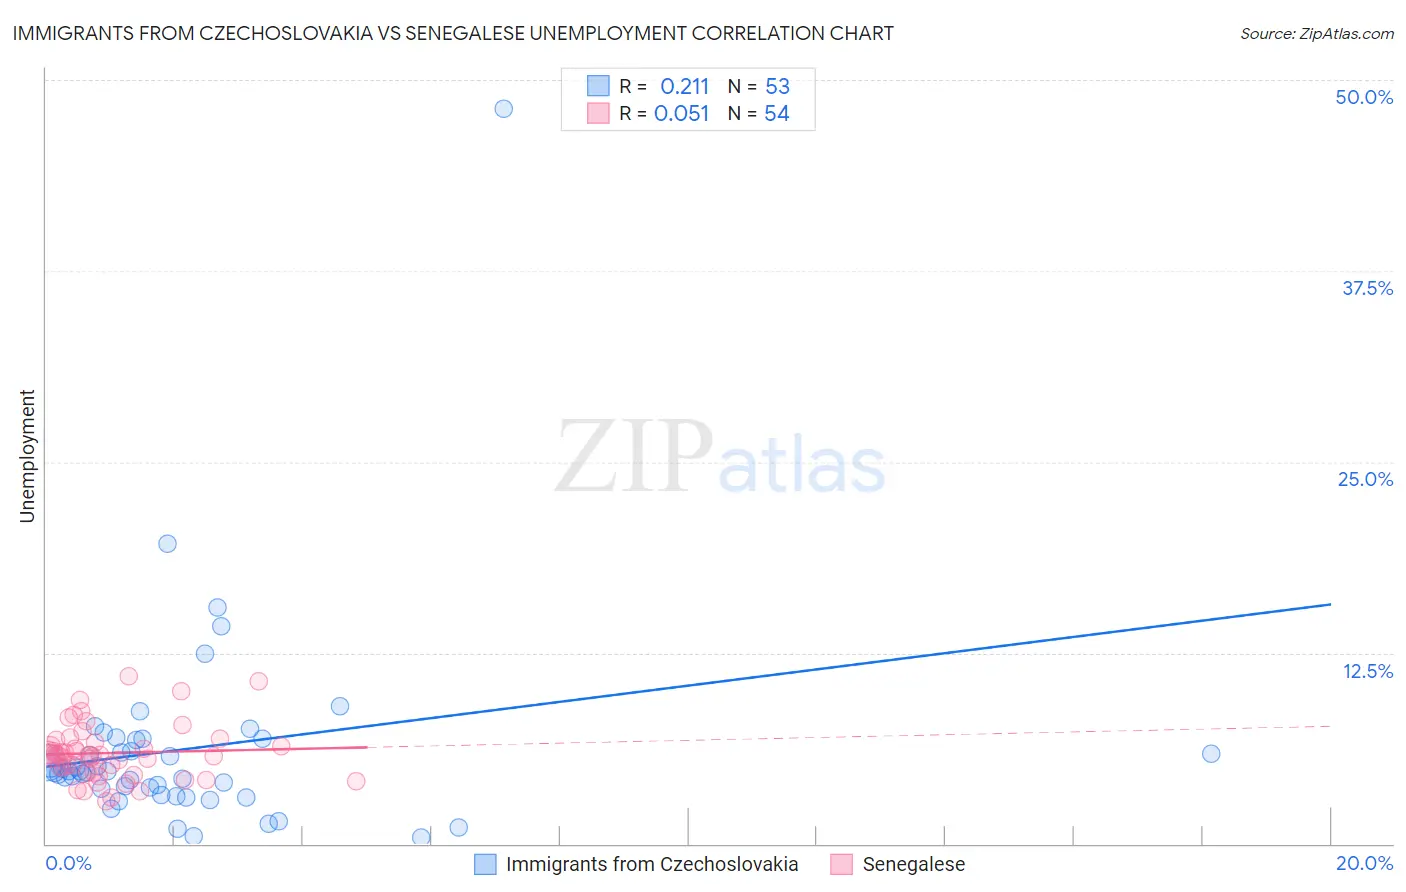
Immigrants from Czechoslovakia vs Senegalese Unemployment Correlation Chart
The statistical analysis conducted on geographies consisting of 195,397,412 people shows a weak positive correlation between the proportion of Immigrants from Czechoslovakia and unemployment in the United States with a correlation coefficient (R) of 0.211 and weighted average of 5.0%. Similarly, the statistical analysis conducted on geographies consisting of 78,136,746 people shows a slight positive correlation between the proportion of Senegalese and unemployment in the United States with a correlation coefficient (R) of 0.051 and weighted average of 6.2%, a difference of 23.6%.
Unemployment Correlation Summary
| Measurement | Immigrants from Czechoslovakia | Senegalese |
| Minimum | 0.40% | 2.8% |
| Maximum | 48.1% | 11.0% |
| Range | 47.7% | 8.2% |
| Mean | 6.2% | 5.9% |
| Median | 4.7% | 5.8% |
| Interquartile 25% (IQ1) | 3.4% | 4.7% |
| Interquartile 75% (IQ3) | 6.9% | 6.7% |
| Interquartile Range (IQR) | 3.5% | 2.0% |
| Standard Deviation (Sample) | 6.9% | 1.8% |
| Standard Deviation (Population) | 6.8% | 1.8% |
Similar Demographics by Unemployment
Demographics Similar to Immigrants from Czechoslovakia by Unemployment
In terms of unemployment, the demographic groups most similar to Immigrants from Czechoslovakia are Immigrants from England (5.0%, a difference of 0.030%), Romanian (5.0%, a difference of 0.030%), Mongolian (5.0%, a difference of 0.10%), Estonian (5.0%, a difference of 0.16%), and Immigrants from Serbia (5.0%, a difference of 0.19%).
| Demographics | Rating | Rank | Unemployment |
| Immigrants | North Macedonia | 96.3 /100 | #90 | Exceptional 5.0% |
| Immigrants | Sudan | 96.3 /100 | #91 | Exceptional 5.0% |
| Immigrants | South Africa | 96.2 /100 | #92 | Exceptional 5.0% |
| Ukrainians | 96.0 /100 | #93 | Exceptional 5.0% |
| Immigrants | Austria | 95.9 /100 | #94 | Exceptional 5.0% |
| Immigrants | Serbia | 95.6 /100 | #95 | Exceptional 5.0% |
| Immigrants | England | 95.2 /100 | #96 | Exceptional 5.0% |
| Immigrants | Czechoslovakia | 95.1 /100 | #97 | Exceptional 5.0% |
| Romanians | 95.0 /100 | #98 | Exceptional 5.0% |
| Mongolians | 94.8 /100 | #99 | Exceptional 5.0% |
| Estonians | 94.6 /100 | #100 | Exceptional 5.0% |
| Americans | 94.3 /100 | #101 | Exceptional 5.0% |
| Immigrants | Argentina | 94.1 /100 | #102 | Exceptional 5.0% |
| Chickasaw | 94.0 /100 | #103 | Exceptional 5.0% |
| Osage | 94.0 /100 | #104 | Exceptional 5.0% |
Demographics Similar to Senegalese by Unemployment
In terms of unemployment, the demographic groups most similar to Senegalese are Chippewa (6.2%, a difference of 0.090%), Ecuadorian (6.2%, a difference of 0.44%), Nepalese (6.2%, a difference of 0.47%), Haitian (6.2%, a difference of 0.53%), and Central American Indian (6.2%, a difference of 0.54%).
| Demographics | Rating | Rank | Unemployment |
| Immigrants | Ghana | 0.0 /100 | #283 | Tragic 6.1% |
| Aleuts | 0.0 /100 | #284 | Tragic 6.1% |
| Immigrants | Senegal | 0.0 /100 | #285 | Tragic 6.1% |
| Immigrants | Caribbean | 0.0 /100 | #286 | Tragic 6.2% |
| Nepalese | 0.0 /100 | #287 | Tragic 6.2% |
| Ecuadorians | 0.0 /100 | #288 | Tragic 6.2% |
| Chippewa | 0.0 /100 | #289 | Tragic 6.2% |
| Senegalese | 0.0 /100 | #290 | Tragic 6.2% |
| Haitians | 0.0 /100 | #291 | Tragic 6.2% |
| Central American Indians | 0.0 /100 | #292 | Tragic 6.2% |
| Immigrants | Ecuador | 0.0 /100 | #293 | Tragic 6.2% |
| Spanish American Indians | 0.0 /100 | #294 | Tragic 6.2% |
| U.S. Virgin Islanders | 0.0 /100 | #295 | Tragic 6.3% |
| Ute | 0.0 /100 | #296 | Tragic 6.3% |
| Jamaicans | 0.0 /100 | #297 | Tragic 6.3% |