Macedonian vs Immigrants from Bahamas Unemployment
COMPARE
Macedonian
Immigrants from Bahamas
Unemployment
Unemployment Comparison
Macedonians
Immigrants from Bahamas
5.1%
UNEMPLOYMENT
89.7/ 100
METRIC RATING
120th/ 347
METRIC RANK
5.8%
UNEMPLOYMENT
0.1/ 100
METRIC RATING
258th/ 347
METRIC RANK
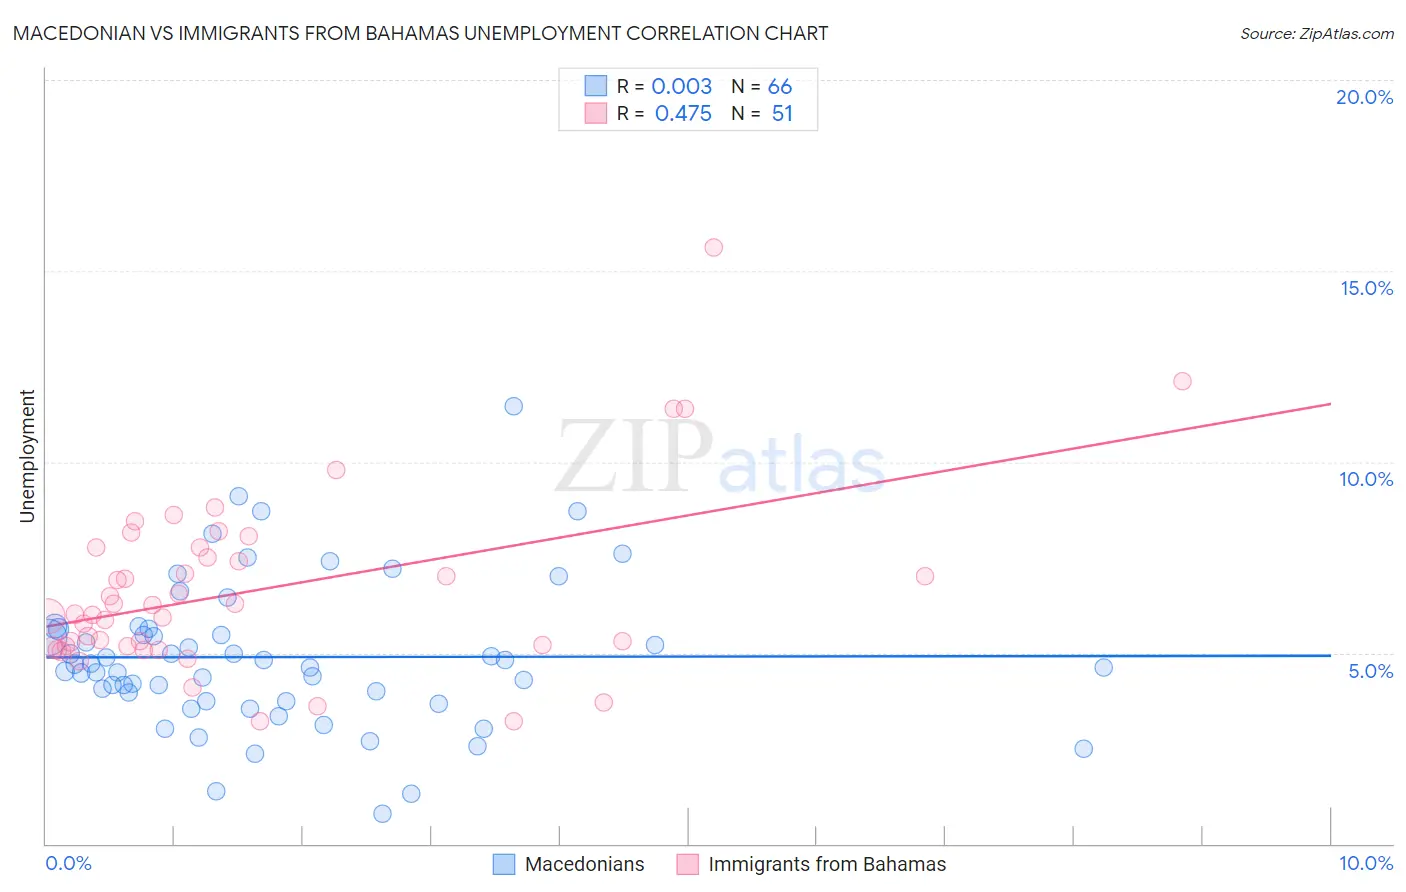
Macedonian vs Immigrants from Bahamas Unemployment Correlation Chart
The statistical analysis conducted on geographies consisting of 132,628,728 people shows no correlation between the proportion of Macedonians and unemployment in the United States with a correlation coefficient (R) of 0.003 and weighted average of 5.1%. Similarly, the statistical analysis conducted on geographies consisting of 104,648,051 people shows a moderate positive correlation between the proportion of Immigrants from Bahamas and unemployment in the United States with a correlation coefficient (R) of 0.475 and weighted average of 5.8%, a difference of 13.8%.
Unemployment Correlation Summary
| Measurement | Macedonian | Immigrants from Bahamas |
| Minimum | 0.80% | 3.2% |
| Maximum | 11.4% | 15.6% |
| Range | 10.6% | 12.4% |
| Mean | 4.9% | 6.6% |
| Median | 4.7% | 6.0% |
| Interquartile 25% (IQ1) | 3.7% | 5.2% |
| Interquartile 75% (IQ3) | 5.6% | 7.8% |
| Interquartile Range (IQR) | 1.9% | 2.6% |
| Standard Deviation (Sample) | 1.9% | 2.3% |
| Standard Deviation (Population) | 1.9% | 2.3% |
Similar Demographics by Unemployment
Demographics Similar to Macedonians by Unemployment
In terms of unemployment, the demographic groups most similar to Macedonians are Immigrants from France (5.1%, a difference of 0.010%), Lebanese (5.1%, a difference of 0.070%), Immigrants from Switzerland (5.1%, a difference of 0.090%), Asian (5.1%, a difference of 0.11%), and Ethiopian (5.1%, a difference of 0.17%).
| Demographics | Rating | Rank | Unemployment |
| Argentineans | 92.4 /100 | #113 | Exceptional 5.1% |
| Immigrants | Ireland | 92.1 /100 | #114 | Exceptional 5.1% |
| Immigrants | Western Europe | 91.1 /100 | #115 | Exceptional 5.1% |
| Immigrants | Sri Lanka | 91.1 /100 | #116 | Exceptional 5.1% |
| Immigrants | Malaysia | 91.0 /100 | #117 | Exceptional 5.1% |
| Immigrants | Germany | 90.8 /100 | #118 | Exceptional 5.1% |
| Immigrants | France | 89.7 /100 | #119 | Excellent 5.1% |
| Macedonians | 89.7 /100 | #120 | Excellent 5.1% |
| Lebanese | 89.2 /100 | #121 | Excellent 5.1% |
| Immigrants | Switzerland | 89.1 /100 | #122 | Excellent 5.1% |
| Asians | 89.0 /100 | #123 | Excellent 5.1% |
| Ethiopians | 88.6 /100 | #124 | Excellent 5.1% |
| Immigrants | Eastern Asia | 88.3 /100 | #125 | Excellent 5.1% |
| Kenyans | 88.2 /100 | #126 | Excellent 5.1% |
| Immigrants | Kenya | 88.2 /100 | #127 | Excellent 5.1% |
Demographics Similar to Immigrants from Bahamas by Unemployment
In terms of unemployment, the demographic groups most similar to Immigrants from Bahamas are Subsaharan African (5.8%, a difference of 0.12%), Yaqui (5.8%, a difference of 0.14%), Immigrants from Uzbekistan (5.8%, a difference of 0.14%), Immigrants from Guatemala (5.8%, a difference of 0.16%), and Sierra Leonean (5.8%, a difference of 0.26%).
| Demographics | Rating | Rank | Unemployment |
| Kiowa | 0.6 /100 | #251 | Tragic 5.7% |
| Hondurans | 0.3 /100 | #252 | Tragic 5.7% |
| Central Americans | 0.3 /100 | #253 | Tragic 5.7% |
| Immigrants | Honduras | 0.3 /100 | #254 | Tragic 5.7% |
| Immigrants | Portugal | 0.2 /100 | #255 | Tragic 5.7% |
| Guatemalans | 0.2 /100 | #256 | Tragic 5.8% |
| Yaqui | 0.2 /100 | #257 | Tragic 5.8% |
| Immigrants | Bahamas | 0.1 /100 | #258 | Tragic 5.8% |
| Sub-Saharan Africans | 0.1 /100 | #259 | Tragic 5.8% |
| Immigrants | Uzbekistan | 0.1 /100 | #260 | Tragic 5.8% |
| Immigrants | Guatemala | 0.1 /100 | #261 | Tragic 5.8% |
| Sierra Leoneans | 0.1 /100 | #262 | Tragic 5.8% |
| Salvadorans | 0.1 /100 | #263 | Tragic 5.8% |
| Immigrants | Liberia | 0.1 /100 | #264 | Tragic 5.8% |
| Nigerians | 0.1 /100 | #265 | Tragic 5.8% |