Macedonian vs Swiss Unemployment
COMPARE
Macedonian
Swiss
Unemployment
Unemployment Comparison
Macedonians
Swiss
5.1%
UNEMPLOYMENT
89.7/ 100
METRIC RATING
120th/ 347
METRIC RANK
4.5%
UNEMPLOYMENT
100.0/ 100
METRIC RATING
8th/ 347
METRIC RANK
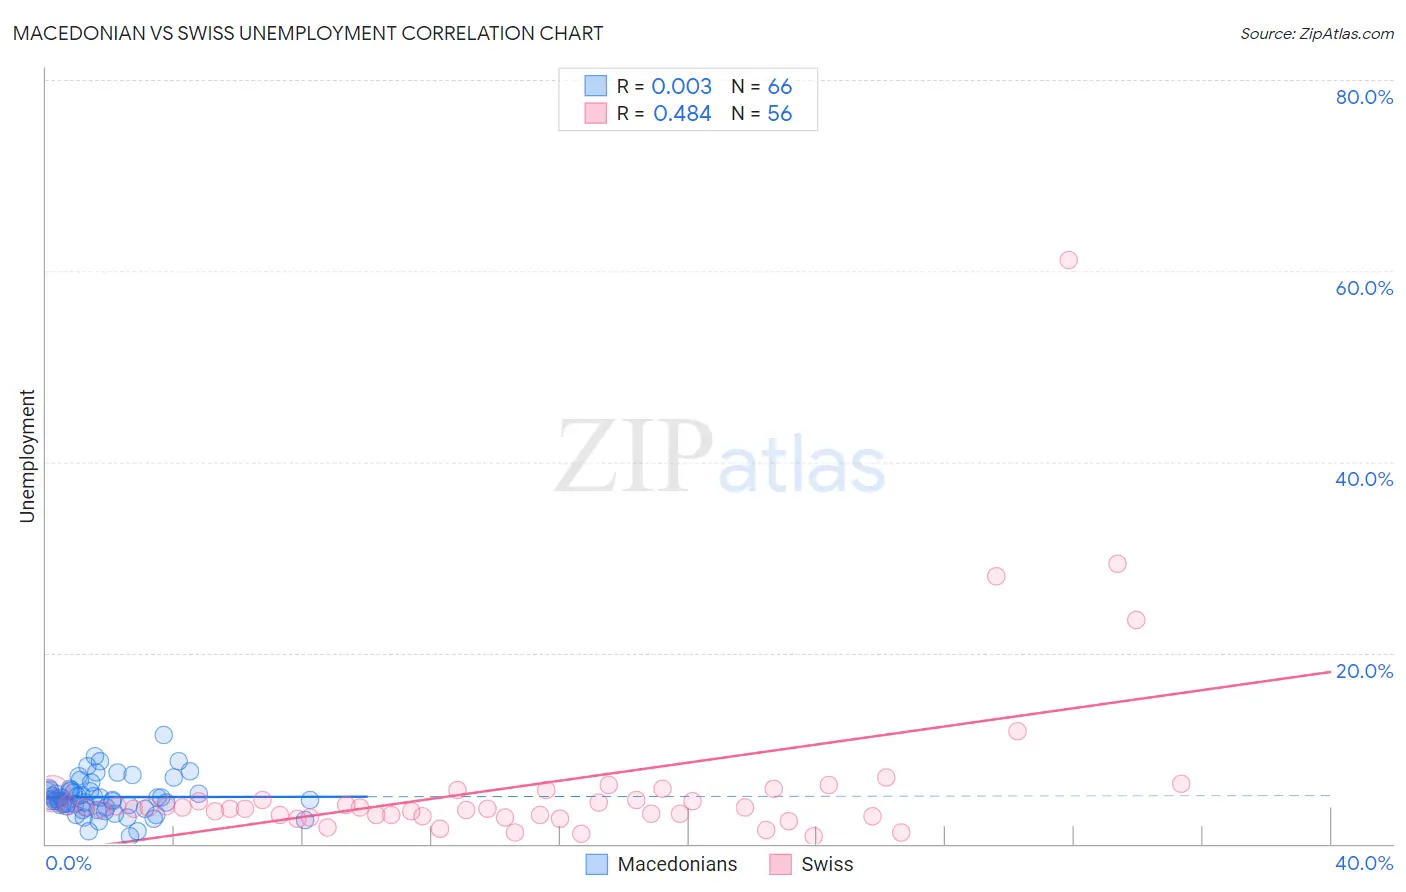
Macedonian vs Swiss Unemployment Correlation Chart
The statistical analysis conducted on geographies consisting of 132,628,728 people shows no correlation between the proportion of Macedonians and unemployment in the United States with a correlation coefficient (R) of 0.003 and weighted average of 5.1%. Similarly, the statistical analysis conducted on geographies consisting of 463,573,695 people shows a moderate positive correlation between the proportion of Swiss and unemployment in the United States with a correlation coefficient (R) of 0.484 and weighted average of 4.5%, a difference of 12.2%.
Unemployment Correlation Summary
| Measurement | Macedonian | Swiss |
| Minimum | 0.80% | 0.84% |
| Maximum | 11.4% | 61.1% |
| Range | 10.6% | 60.3% |
| Mean | 4.9% | 6.1% |
| Median | 4.7% | 3.7% |
| Interquartile 25% (IQ1) | 3.7% | 2.9% |
| Interquartile 75% (IQ3) | 5.6% | 4.9% |
| Interquartile Range (IQR) | 1.9% | 1.9% |
| Standard Deviation (Sample) | 1.9% | 9.3% |
| Standard Deviation (Population) | 1.9% | 9.2% |
Similar Demographics by Unemployment
Demographics Similar to Macedonians by Unemployment
In terms of unemployment, the demographic groups most similar to Macedonians are Immigrants from France (5.1%, a difference of 0.010%), Lebanese (5.1%, a difference of 0.070%), Immigrants from Switzerland (5.1%, a difference of 0.090%), Asian (5.1%, a difference of 0.11%), and Ethiopian (5.1%, a difference of 0.17%).
| Demographics | Rating | Rank | Unemployment |
| Argentineans | 92.4 /100 | #113 | Exceptional 5.1% |
| Immigrants | Ireland | 92.1 /100 | #114 | Exceptional 5.1% |
| Immigrants | Western Europe | 91.1 /100 | #115 | Exceptional 5.1% |
| Immigrants | Sri Lanka | 91.1 /100 | #116 | Exceptional 5.1% |
| Immigrants | Malaysia | 91.0 /100 | #117 | Exceptional 5.1% |
| Immigrants | Germany | 90.8 /100 | #118 | Exceptional 5.1% |
| Immigrants | France | 89.7 /100 | #119 | Excellent 5.1% |
| Macedonians | 89.7 /100 | #120 | Excellent 5.1% |
| Lebanese | 89.2 /100 | #121 | Excellent 5.1% |
| Immigrants | Switzerland | 89.1 /100 | #122 | Excellent 5.1% |
| Asians | 89.0 /100 | #123 | Excellent 5.1% |
| Ethiopians | 88.6 /100 | #124 | Excellent 5.1% |
| Immigrants | Eastern Asia | 88.3 /100 | #125 | Excellent 5.1% |
| Kenyans | 88.2 /100 | #126 | Excellent 5.1% |
| Immigrants | Kenya | 88.2 /100 | #127 | Excellent 5.1% |
Demographics Similar to Swiss by Unemployment
In terms of unemployment, the demographic groups most similar to Swiss are Scandinavian (4.5%, a difference of 0.39%), Immigrants from India (4.5%, a difference of 0.46%), Dutch (4.6%, a difference of 0.90%), German (4.5%, a difference of 1.0%), and English (4.6%, a difference of 1.6%).
| Demographics | Rating | Rank | Unemployment |
| Norwegians | 100.0 /100 | #1 | Exceptional 4.2% |
| Luxembourgers | 100.0 /100 | #2 | Exceptional 4.3% |
| Czechs | 100.0 /100 | #3 | Exceptional 4.3% |
| Danes | 100.0 /100 | #4 | Exceptional 4.3% |
| Swedes | 100.0 /100 | #5 | Exceptional 4.4% |
| Germans | 100.0 /100 | #6 | Exceptional 4.5% |
| Immigrants | India | 100.0 /100 | #7 | Exceptional 4.5% |
| Swiss | 100.0 /100 | #8 | Exceptional 4.5% |
| Scandinavians | 100.0 /100 | #9 | Exceptional 4.5% |
| Dutch | 100.0 /100 | #10 | Exceptional 4.6% |
| English | 100.0 /100 | #11 | Exceptional 4.6% |
| Pennsylvania Germans | 100.0 /100 | #12 | Exceptional 4.6% |
| Belgians | 100.0 /100 | #13 | Exceptional 4.6% |
| Immigrants | Cuba | 100.0 /100 | #14 | Exceptional 4.6% |
| Europeans | 99.9 /100 | #15 | Exceptional 4.6% |