Macedonian vs Spaniard Unemployment
COMPARE
Macedonian
Spaniard
Unemployment
Unemployment Comparison
Macedonians
Spaniards
5.1%
UNEMPLOYMENT
89.7/ 100
METRIC RATING
120th/ 347
METRIC RANK
5.3%
UNEMPLOYMENT
42.2/ 100
METRIC RATING
182nd/ 347
METRIC RANK
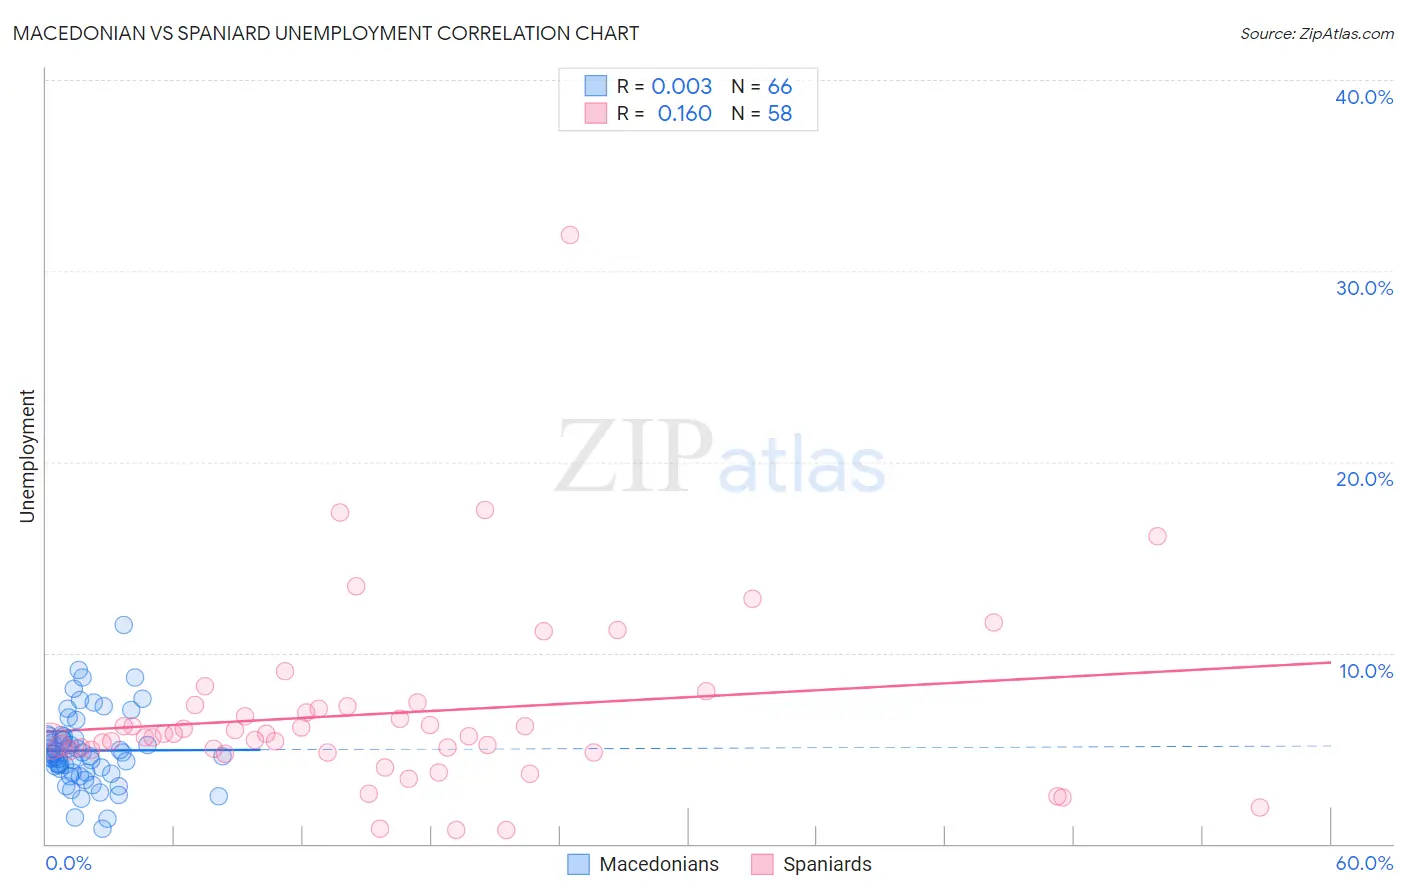
Macedonian vs Spaniard Unemployment Correlation Chart
The statistical analysis conducted on geographies consisting of 132,628,728 people shows no correlation between the proportion of Macedonians and unemployment in the United States with a correlation coefficient (R) of 0.003 and weighted average of 5.1%. Similarly, the statistical analysis conducted on geographies consisting of 442,859,385 people shows a poor positive correlation between the proportion of Spaniards and unemployment in the United States with a correlation coefficient (R) of 0.160 and weighted average of 5.3%, a difference of 3.9%.
Unemployment Correlation Summary
| Measurement | Macedonian | Spaniard |
| Minimum | 0.80% | 0.70% |
| Maximum | 11.4% | 31.9% |
| Range | 10.6% | 31.2% |
| Mean | 4.9% | 6.8% |
| Median | 4.7% | 5.7% |
| Interquartile 25% (IQ1) | 3.7% | 4.9% |
| Interquartile 75% (IQ3) | 5.6% | 7.2% |
| Interquartile Range (IQR) | 1.9% | 2.3% |
| Standard Deviation (Sample) | 1.9% | 4.9% |
| Standard Deviation (Population) | 1.9% | 4.9% |
Similar Demographics by Unemployment
Demographics Similar to Macedonians by Unemployment
In terms of unemployment, the demographic groups most similar to Macedonians are Immigrants from France (5.1%, a difference of 0.010%), Lebanese (5.1%, a difference of 0.070%), Immigrants from Switzerland (5.1%, a difference of 0.090%), Asian (5.1%, a difference of 0.11%), and Ethiopian (5.1%, a difference of 0.17%).
| Demographics | Rating | Rank | Unemployment |
| Argentineans | 92.4 /100 | #113 | Exceptional 5.1% |
| Immigrants | Ireland | 92.1 /100 | #114 | Exceptional 5.1% |
| Immigrants | Western Europe | 91.1 /100 | #115 | Exceptional 5.1% |
| Immigrants | Sri Lanka | 91.1 /100 | #116 | Exceptional 5.1% |
| Immigrants | Malaysia | 91.0 /100 | #117 | Exceptional 5.1% |
| Immigrants | Germany | 90.8 /100 | #118 | Exceptional 5.1% |
| Immigrants | France | 89.7 /100 | #119 | Excellent 5.1% |
| Macedonians | 89.7 /100 | #120 | Excellent 5.1% |
| Lebanese | 89.2 /100 | #121 | Excellent 5.1% |
| Immigrants | Switzerland | 89.1 /100 | #122 | Excellent 5.1% |
| Asians | 89.0 /100 | #123 | Excellent 5.1% |
| Ethiopians | 88.6 /100 | #124 | Excellent 5.1% |
| Immigrants | Eastern Asia | 88.3 /100 | #125 | Excellent 5.1% |
| Kenyans | 88.2 /100 | #126 | Excellent 5.1% |
| Immigrants | Kenya | 88.2 /100 | #127 | Excellent 5.1% |
Demographics Similar to Spaniards by Unemployment
In terms of unemployment, the demographic groups most similar to Spaniards are Albanian (5.3%, a difference of 0.080%), Brazilian (5.3%, a difference of 0.13%), Immigrants from Greece (5.3%, a difference of 0.18%), Assyrian/Chaldean/Syriac (5.3%, a difference of 0.19%), and Immigrants from Thailand (5.3%, a difference of 0.21%).
| Demographics | Rating | Rank | Unemployment |
| Taiwanese | 49.6 /100 | #175 | Average 5.3% |
| Nicaraguans | 48.7 /100 | #176 | Average 5.3% |
| Immigrants | Nonimmigrants | 47.9 /100 | #177 | Average 5.3% |
| Afghans | 47.4 /100 | #178 | Average 5.3% |
| Malaysians | 46.8 /100 | #179 | Average 5.3% |
| Immigrants | Greece | 45.0 /100 | #180 | Average 5.3% |
| Albanians | 43.5 /100 | #181 | Average 5.3% |
| Spaniards | 42.2 /100 | #182 | Average 5.3% |
| Brazilians | 40.2 /100 | #183 | Average 5.3% |
| Assyrians/Chaldeans/Syriacs | 39.2 /100 | #184 | Fair 5.3% |
| Immigrants | Thailand | 38.9 /100 | #185 | Fair 5.3% |
| Immigrants | Uganda | 37.8 /100 | #186 | Fair 5.3% |
| Costa Ricans | 37.4 /100 | #187 | Fair 5.3% |
| Alsatians | 37.0 /100 | #188 | Fair 5.3% |
| Immigrants | Belarus | 35.6 /100 | #189 | Fair 5.3% |