Macedonian vs Senegalese Family Poverty
COMPARE
Macedonian
Senegalese
Family Poverty
Family Poverty Comparison
Macedonians
Senegalese
7.8%
FAMILY POVERTY
98.6/ 100
METRIC RATING
62nd/ 347
METRIC RANK
11.5%
FAMILY POVERTY
0.0/ 100
METRIC RATING
286th/ 347
METRIC RANK
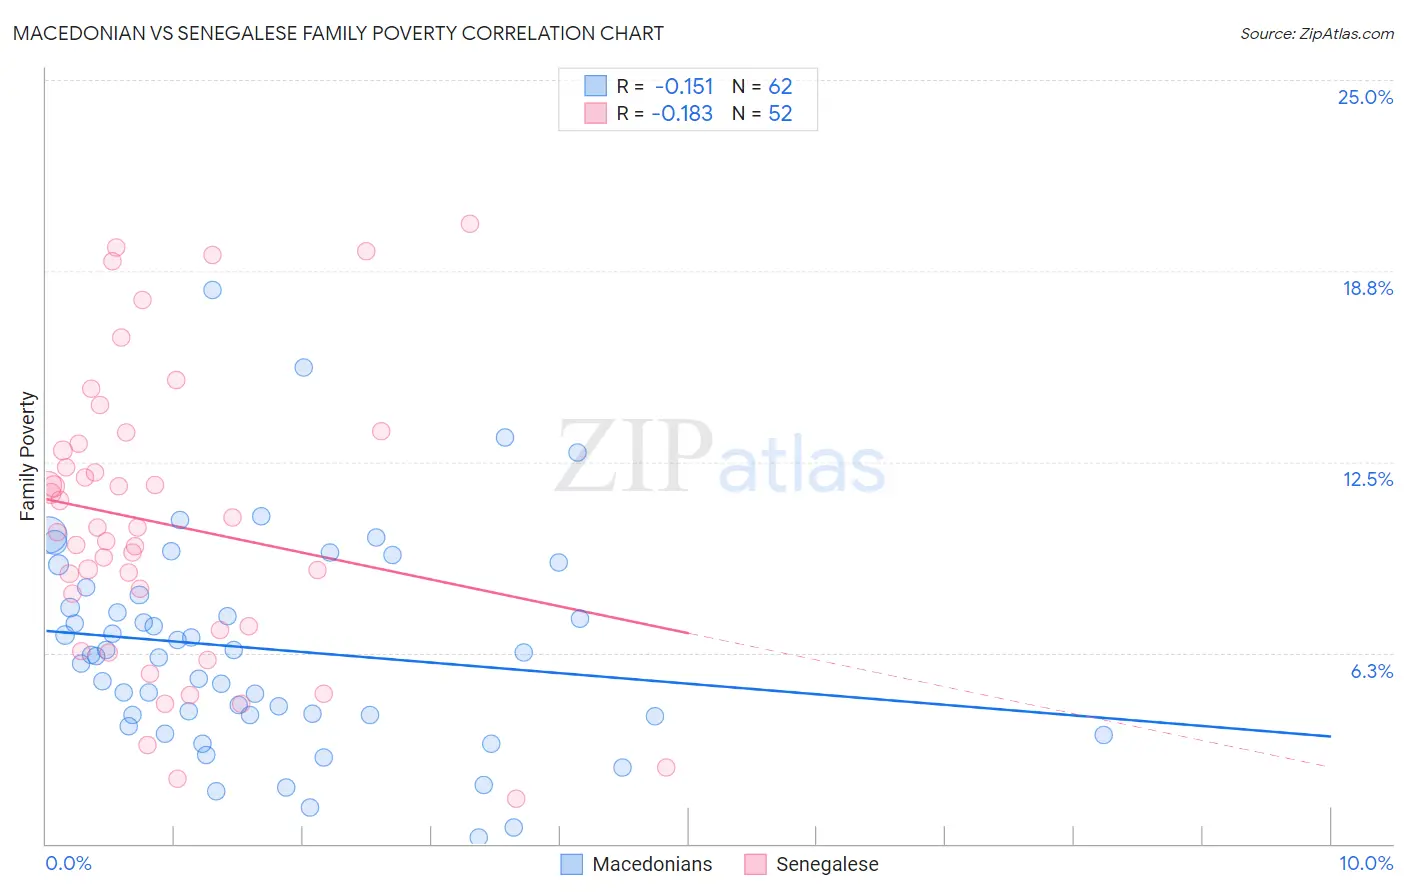
Macedonian vs Senegalese Family Poverty Correlation Chart
The statistical analysis conducted on geographies consisting of 132,470,944 people shows a poor negative correlation between the proportion of Macedonians and poverty level among families in the United States with a correlation coefficient (R) of -0.151 and weighted average of 7.8%. Similarly, the statistical analysis conducted on geographies consisting of 78,085,105 people shows a poor negative correlation between the proportion of Senegalese and poverty level among families in the United States with a correlation coefficient (R) of -0.183 and weighted average of 11.5%, a difference of 47.7%.
Family Poverty Correlation Summary
| Measurement | Macedonian | Senegalese |
| Minimum | 0.19% | 1.5% |
| Maximum | 18.1% | 20.3% |
| Range | 17.9% | 18.9% |
| Mean | 6.4% | 10.5% |
| Median | 6.2% | 10.3% |
| Interquartile 25% (IQ1) | 4.2% | 7.1% |
| Interquartile 75% (IQ3) | 8.1% | 13.0% |
| Interquartile Range (IQR) | 3.9% | 5.9% |
| Standard Deviation (Sample) | 3.5% | 4.7% |
| Standard Deviation (Population) | 3.4% | 4.7% |
Similar Demographics by Family Poverty
Demographics Similar to Macedonians by Family Poverty
In terms of family poverty, the demographic groups most similar to Macedonians are Immigrants from Netherlands (7.7%, a difference of 0.19%), Immigrants from Greece (7.7%, a difference of 0.37%), European (7.7%, a difference of 0.38%), Finnish (7.7%, a difference of 0.39%), and Asian (7.7%, a difference of 0.42%).
| Demographics | Rating | Rank | Family Poverty |
| Immigrants | Eastern Asia | 98.7 /100 | #55 | Exceptional 7.7% |
| Immigrants | Serbia | 98.7 /100 | #56 | Exceptional 7.7% |
| Asians | 98.7 /100 | #57 | Exceptional 7.7% |
| Finns | 98.7 /100 | #58 | Exceptional 7.7% |
| Europeans | 98.7 /100 | #59 | Exceptional 7.7% |
| Immigrants | Greece | 98.7 /100 | #60 | Exceptional 7.7% |
| Immigrants | Netherlands | 98.6 /100 | #61 | Exceptional 7.7% |
| Macedonians | 98.6 /100 | #62 | Exceptional 7.8% |
| Zimbabweans | 98.4 /100 | #63 | Exceptional 7.8% |
| Koreans | 98.3 /100 | #64 | Exceptional 7.8% |
| Immigrants | Bulgaria | 98.3 /100 | #65 | Exceptional 7.8% |
| Dutch | 98.3 /100 | #66 | Exceptional 7.8% |
| Northern Europeans | 98.3 /100 | #67 | Exceptional 7.8% |
| Australians | 98.2 /100 | #68 | Exceptional 7.8% |
| Immigrants | Belgium | 98.2 /100 | #69 | Exceptional 7.8% |
Demographics Similar to Senegalese by Family Poverty
In terms of family poverty, the demographic groups most similar to Senegalese are Vietnamese (11.5%, a difference of 0.27%), Immigrants from Belize (11.5%, a difference of 0.46%), Immigrants from Barbados (11.5%, a difference of 0.51%), West Indian (11.5%, a difference of 0.52%), and Haitian (11.5%, a difference of 0.58%).
| Demographics | Rating | Rank | Family Poverty |
| Blackfeet | 0.0 /100 | #279 | Tragic 11.3% |
| Belizeans | 0.0 /100 | #280 | Tragic 11.3% |
| Immigrants | West Indies | 0.0 /100 | #281 | Tragic 11.3% |
| Immigrants | Cuba | 0.0 /100 | #282 | Tragic 11.3% |
| Indonesians | 0.0 /100 | #283 | Tragic 11.3% |
| Yaqui | 0.0 /100 | #284 | Tragic 11.3% |
| Barbadians | 0.0 /100 | #285 | Tragic 11.3% |
| Senegalese | 0.0 /100 | #286 | Tragic 11.5% |
| Vietnamese | 0.0 /100 | #287 | Tragic 11.5% |
| Immigrants | Belize | 0.0 /100 | #288 | Tragic 11.5% |
| Immigrants | Barbados | 0.0 /100 | #289 | Tragic 11.5% |
| West Indians | 0.0 /100 | #290 | Tragic 11.5% |
| Haitians | 0.0 /100 | #291 | Tragic 11.5% |
| Immigrants | Somalia | 0.0 /100 | #292 | Tragic 11.5% |
| Immigrants | Cabo Verde | 0.0 /100 | #293 | Tragic 11.6% |