Guamanian/Chamorro vs Senegalese Unemployment
COMPARE
Guamanian/Chamorro
Senegalese
Unemployment
Unemployment Comparison
Guamanians/Chamorros
Senegalese
5.5%
UNEMPLOYMENT
6.3/ 100
METRIC RATING
228th/ 347
METRIC RANK
6.2%
UNEMPLOYMENT
0.0/ 100
METRIC RATING
290th/ 347
METRIC RANK
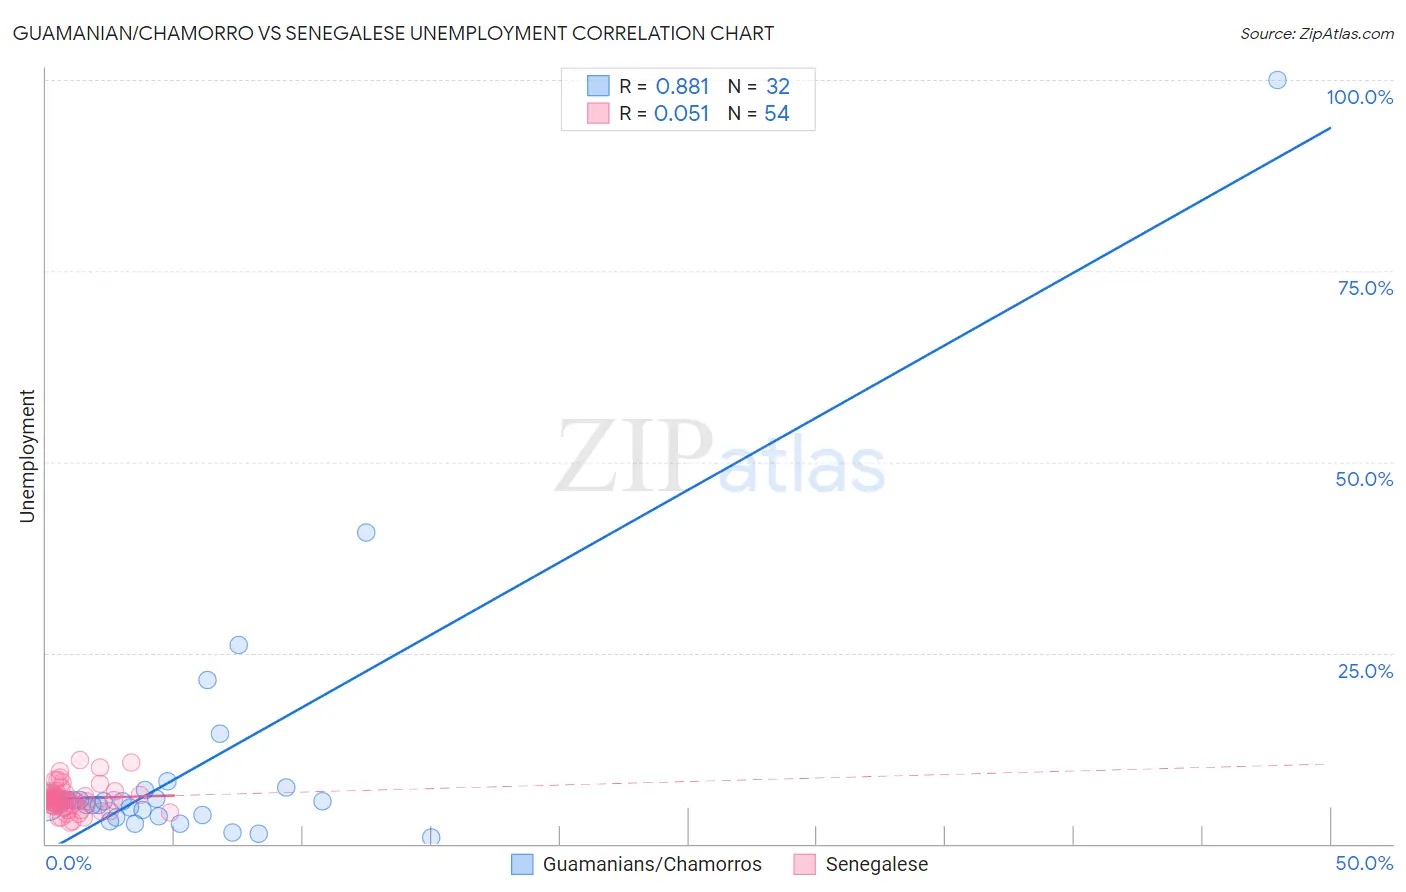
Guamanian/Chamorro vs Senegalese Unemployment Correlation Chart
The statistical analysis conducted on geographies consisting of 221,788,183 people shows a very strong positive correlation between the proportion of Guamanians/Chamorros and unemployment in the United States with a correlation coefficient (R) of 0.881 and weighted average of 5.5%. Similarly, the statistical analysis conducted on geographies consisting of 78,136,746 people shows a slight positive correlation between the proportion of Senegalese and unemployment in the United States with a correlation coefficient (R) of 0.051 and weighted average of 6.2%, a difference of 13.3%.
Unemployment Correlation Summary
| Measurement | Guamanian/Chamorro | Senegalese |
| Minimum | 0.80% | 2.8% |
| Maximum | 100.0% | 11.0% |
| Range | 99.2% | 8.2% |
| Mean | 10.3% | 5.9% |
| Median | 5.5% | 5.8% |
| Interquartile 25% (IQ1) | 3.6% | 4.7% |
| Interquartile 75% (IQ3) | 6.5% | 6.7% |
| Interquartile Range (IQR) | 2.8% | 2.0% |
| Standard Deviation (Sample) | 18.2% | 1.8% |
| Standard Deviation (Population) | 17.9% | 1.8% |
Similar Demographics by Unemployment
Demographics Similar to Guamanians/Chamorros by Unemployment
In terms of unemployment, the demographic groups most similar to Guamanians/Chamorros are Immigrants from Lebanon (5.5%, a difference of 0.15%), Samoan (5.5%, a difference of 0.18%), Hawaiian (5.5%, a difference of 0.26%), Ottawa (5.5%, a difference of 0.26%), and South American Indian (5.5%, a difference of 0.33%).
| Demographics | Rating | Rank | Unemployment |
| Immigrants | Philippines | 10.4 /100 | #221 | Poor 5.4% |
| Iroquois | 10.3 /100 | #222 | Poor 5.4% |
| Seminole | 9.2 /100 | #223 | Tragic 5.4% |
| Israelis | 8.8 /100 | #224 | Tragic 5.4% |
| South American Indians | 7.8 /100 | #225 | Tragic 5.5% |
| Samoans | 7.1 /100 | #226 | Tragic 5.5% |
| Immigrants | Lebanon | 7.0 /100 | #227 | Tragic 5.5% |
| Guamanians/Chamorros | 6.3 /100 | #228 | Tragic 5.5% |
| Hawaiians | 5.4 /100 | #229 | Tragic 5.5% |
| Ottawa | 5.4 /100 | #230 | Tragic 5.5% |
| Immigrants | Africa | 4.9 /100 | #231 | Tragic 5.5% |
| Comanche | 4.9 /100 | #232 | Tragic 5.5% |
| Immigrants | Syria | 4.8 /100 | #233 | Tragic 5.5% |
| Panamanians | 4.7 /100 | #234 | Tragic 5.5% |
| Immigrants | Panama | 3.4 /100 | #235 | Tragic 5.5% |
Demographics Similar to Senegalese by Unemployment
In terms of unemployment, the demographic groups most similar to Senegalese are Chippewa (6.2%, a difference of 0.090%), Ecuadorian (6.2%, a difference of 0.44%), Nepalese (6.2%, a difference of 0.47%), Haitian (6.2%, a difference of 0.53%), and Central American Indian (6.2%, a difference of 0.54%).
| Demographics | Rating | Rank | Unemployment |
| Immigrants | Ghana | 0.0 /100 | #283 | Tragic 6.1% |
| Aleuts | 0.0 /100 | #284 | Tragic 6.1% |
| Immigrants | Senegal | 0.0 /100 | #285 | Tragic 6.1% |
| Immigrants | Caribbean | 0.0 /100 | #286 | Tragic 6.2% |
| Nepalese | 0.0 /100 | #287 | Tragic 6.2% |
| Ecuadorians | 0.0 /100 | #288 | Tragic 6.2% |
| Chippewa | 0.0 /100 | #289 | Tragic 6.2% |
| Senegalese | 0.0 /100 | #290 | Tragic 6.2% |
| Haitians | 0.0 /100 | #291 | Tragic 6.2% |
| Central American Indians | 0.0 /100 | #292 | Tragic 6.2% |
| Immigrants | Ecuador | 0.0 /100 | #293 | Tragic 6.2% |
| Spanish American Indians | 0.0 /100 | #294 | Tragic 6.2% |
| U.S. Virgin Islanders | 0.0 /100 | #295 | Tragic 6.3% |
| Ute | 0.0 /100 | #296 | Tragic 6.3% |
| Jamaicans | 0.0 /100 | #297 | Tragic 6.3% |