Immigrants from Eastern Africa vs Nepalese Female Unemployment
COMPARE
Immigrants from Eastern Africa
Nepalese
Female Unemployment
Female Unemployment Comparison
Immigrants from Eastern Africa
Nepalese
5.1%
FEMALE UNEMPLOYMENT
92.8/ 100
METRIC RATING
109th/ 347
METRIC RANK
5.9%
FEMALE UNEMPLOYMENT
0.0/ 100
METRIC RATING
267th/ 347
METRIC RANK
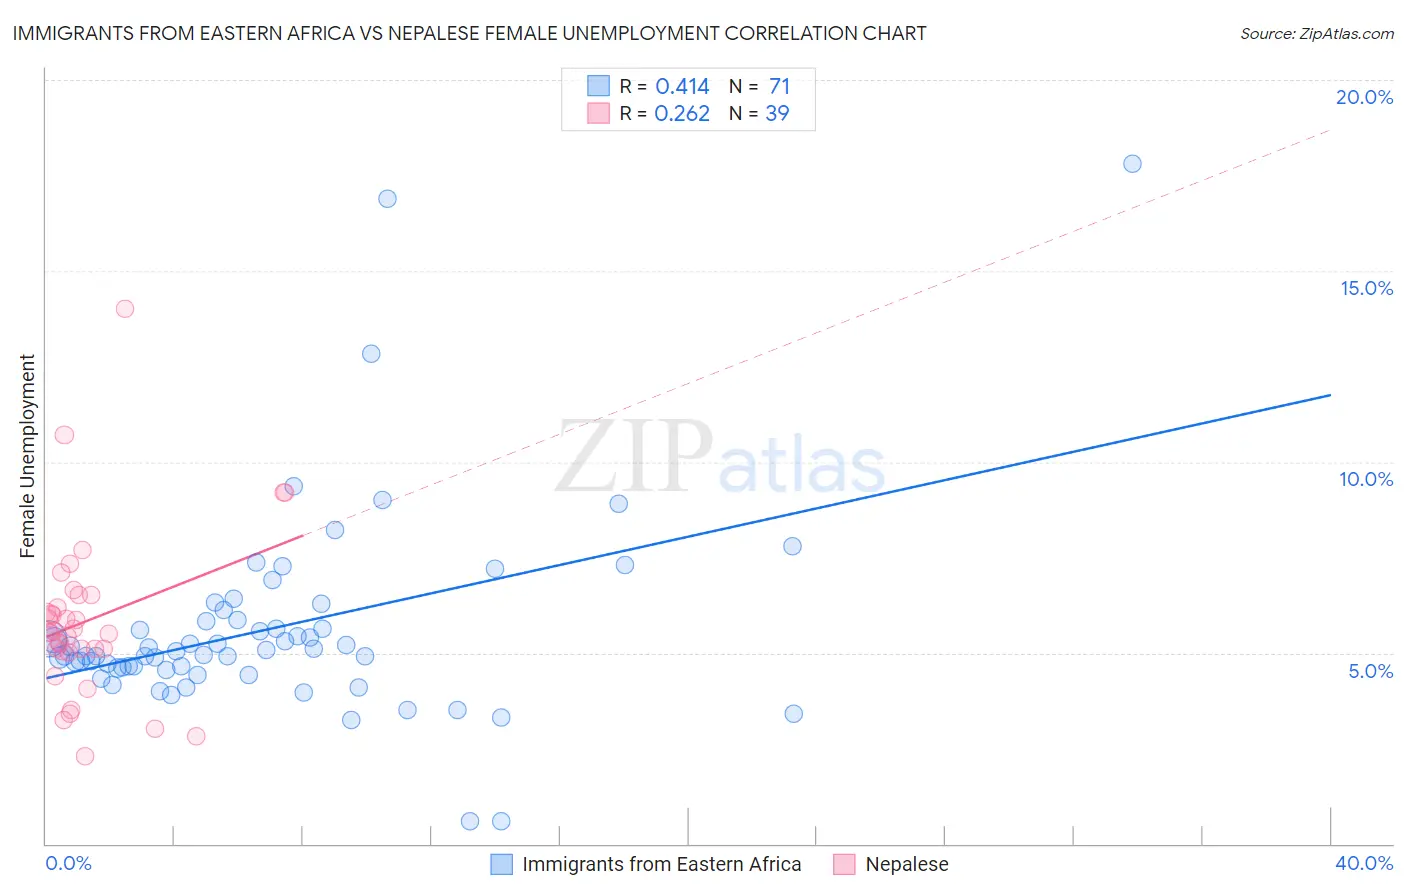
Immigrants from Eastern Africa vs Nepalese Female Unemployment Correlation Chart
The statistical analysis conducted on geographies consisting of 354,148,137 people shows a moderate positive correlation between the proportion of Immigrants from Eastern Africa and unemploymnet rate among females in the United States with a correlation coefficient (R) of 0.414 and weighted average of 5.1%. Similarly, the statistical analysis conducted on geographies consisting of 24,519,269 people shows a weak positive correlation between the proportion of Nepalese and unemploymnet rate among females in the United States with a correlation coefficient (R) of 0.262 and weighted average of 5.9%, a difference of 16.4%.
Female Unemployment Correlation Summary
| Measurement | Immigrants from Eastern Africa | Nepalese |
| Minimum | 0.60% | 2.3% |
| Maximum | 17.8% | 14.0% |
| Range | 17.2% | 11.7% |
| Mean | 5.6% | 5.8% |
| Median | 5.0% | 5.5% |
| Interquartile 25% (IQ1) | 4.6% | 5.0% |
| Interquartile 75% (IQ3) | 5.9% | 6.5% |
| Interquartile Range (IQR) | 1.3% | 1.5% |
| Standard Deviation (Sample) | 2.7% | 2.2% |
| Standard Deviation (Population) | 2.7% | 2.1% |
Similar Demographics by Female Unemployment
Demographics Similar to Immigrants from Eastern Africa by Female Unemployment
In terms of female unemployment, the demographic groups most similar to Immigrants from Eastern Africa are Puget Sound Salish (5.1%, a difference of 0.040%), Immigrants from Switzerland (5.1%, a difference of 0.060%), Paraguayan (5.1%, a difference of 0.090%), Macedonian (5.1%, a difference of 0.10%), and Immigrants from Burma/Myanmar (5.1%, a difference of 0.13%).
| Demographics | Rating | Rank | Female Unemployment |
| Immigrants | Kenya | 94.8 /100 | #102 | Exceptional 5.0% |
| Somalis | 94.6 /100 | #103 | Exceptional 5.0% |
| Kenyans | 93.7 /100 | #104 | Exceptional 5.0% |
| Immigrants | England | 93.6 /100 | #105 | Exceptional 5.0% |
| Paraguayans | 93.2 /100 | #106 | Exceptional 5.1% |
| Immigrants | Switzerland | 93.1 /100 | #107 | Exceptional 5.1% |
| Puget Sound Salish | 93.0 /100 | #108 | Exceptional 5.1% |
| Immigrants | Eastern Africa | 92.8 /100 | #109 | Exceptional 5.1% |
| Macedonians | 92.4 /100 | #110 | Exceptional 5.1% |
| Immigrants | Burma/Myanmar | 92.3 /100 | #111 | Exceptional 5.1% |
| Estonians | 92.1 /100 | #112 | Exceptional 5.1% |
| Immigrants | Saudi Arabia | 91.2 /100 | #113 | Exceptional 5.1% |
| Immigrants | Turkey | 91.0 /100 | #114 | Exceptional 5.1% |
| Lebanese | 91.0 /100 | #115 | Exceptional 5.1% |
| Americans | 90.5 /100 | #116 | Exceptional 5.1% |
Demographics Similar to Nepalese by Female Unemployment
In terms of female unemployment, the demographic groups most similar to Nepalese are Honduran (5.9%, a difference of 0.10%), Cape Verdean (5.9%, a difference of 0.11%), Immigrants from Western Africa (5.9%, a difference of 0.30%), Blackfeet (5.9%, a difference of 0.39%), and Immigrants from Honduras (5.9%, a difference of 0.71%).
| Demographics | Rating | Rank | Female Unemployment |
| Nigerians | 0.2 /100 | #260 | Tragic 5.8% |
| Kiowa | 0.1 /100 | #261 | Tragic 5.8% |
| Immigrants | Nigeria | 0.1 /100 | #262 | Tragic 5.8% |
| Immigrants | Azores | 0.1 /100 | #263 | Tragic 5.8% |
| Immigrants | Bahamas | 0.1 /100 | #264 | Tragic 5.8% |
| Blackfeet | 0.0 /100 | #265 | Tragic 5.9% |
| Cape Verdeans | 0.0 /100 | #266 | Tragic 5.9% |
| Nepalese | 0.0 /100 | #267 | Tragic 5.9% |
| Hondurans | 0.0 /100 | #268 | Tragic 5.9% |
| Immigrants | Western Africa | 0.0 /100 | #269 | Tragic 5.9% |
| Immigrants | Honduras | 0.0 /100 | #270 | Tragic 5.9% |
| Central Americans | 0.0 /100 | #271 | Tragic 5.9% |
| Lumbee | 0.0 /100 | #272 | Tragic 5.9% |
| Ghanaians | 0.0 /100 | #273 | Tragic 5.9% |
| Africans | 0.0 /100 | #274 | Tragic 5.9% |