Immigrants from Western Asia vs Nepalese Female Unemployment
COMPARE
Immigrants from Western Asia
Nepalese
Female Unemployment
Female Unemployment Comparison
Immigrants from Western Asia
Nepalese
5.6%
FEMALE UNEMPLOYMENT
1.1/ 100
METRIC RATING
247th/ 347
METRIC RANK
5.9%
FEMALE UNEMPLOYMENT
0.0/ 100
METRIC RATING
267th/ 347
METRIC RANK
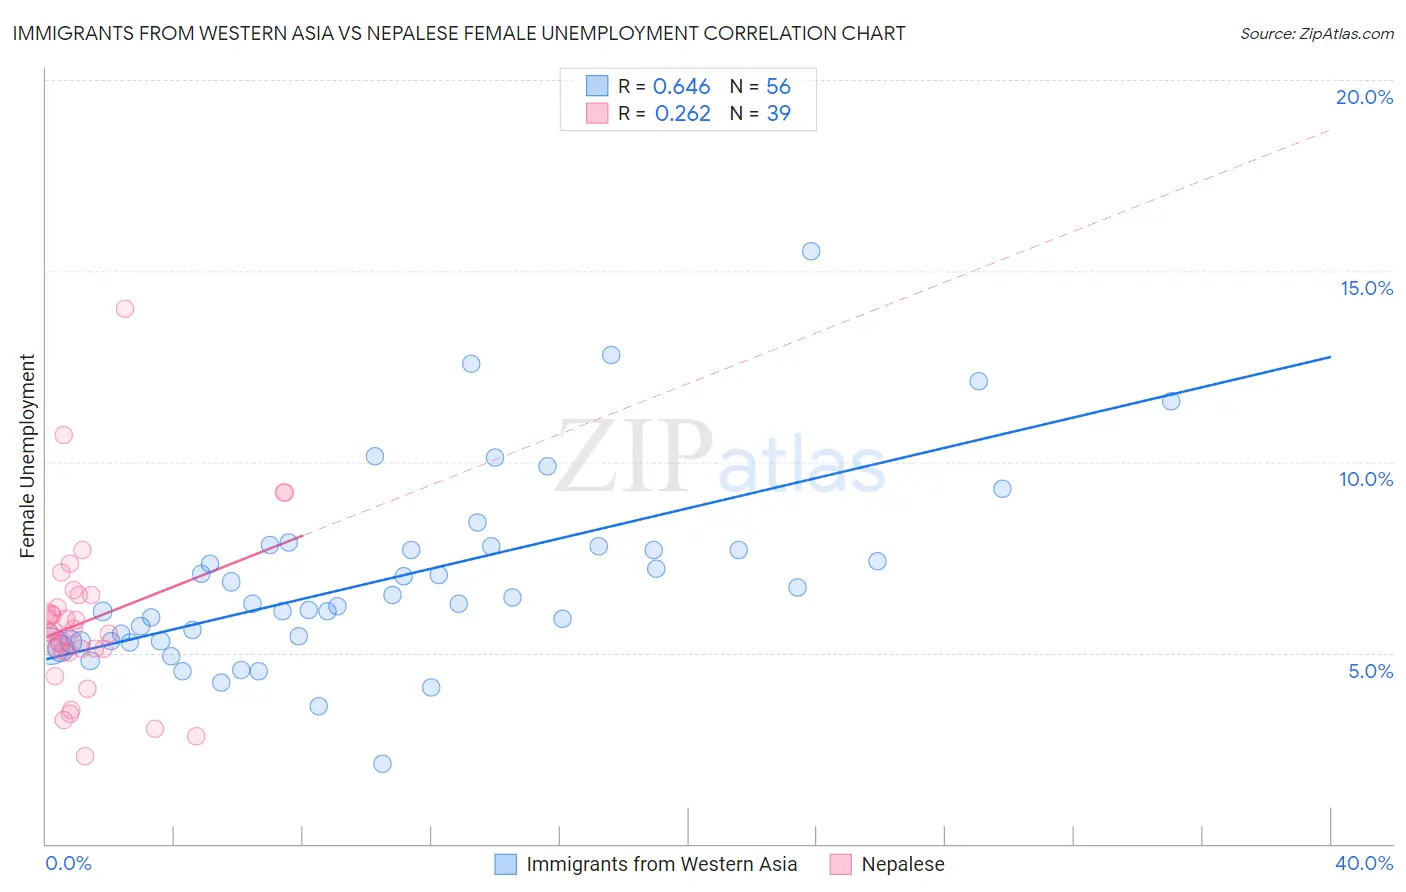
Immigrants from Western Asia vs Nepalese Female Unemployment Correlation Chart
The statistical analysis conducted on geographies consisting of 402,949,071 people shows a significant positive correlation between the proportion of Immigrants from Western Asia and unemploymnet rate among females in the United States with a correlation coefficient (R) of 0.646 and weighted average of 5.6%. Similarly, the statistical analysis conducted on geographies consisting of 24,519,269 people shows a weak positive correlation between the proportion of Nepalese and unemploymnet rate among females in the United States with a correlation coefficient (R) of 0.262 and weighted average of 5.9%, a difference of 4.9%.
Female Unemployment Correlation Summary
| Measurement | Immigrants from Western Asia | Nepalese |
| Minimum | 2.1% | 2.3% |
| Maximum | 15.5% | 14.0% |
| Range | 13.4% | 11.7% |
| Mean | 6.9% | 5.8% |
| Median | 6.3% | 5.5% |
| Interquartile 25% (IQ1) | 5.3% | 5.0% |
| Interquartile 75% (IQ3) | 7.8% | 6.5% |
| Interquartile Range (IQR) | 2.5% | 1.5% |
| Standard Deviation (Sample) | 2.5% | 2.2% |
| Standard Deviation (Population) | 2.5% | 2.1% |
Demographics Similar to Immigrants from Western Asia and Nepalese by Female Unemployment
In terms of female unemployment, the demographic groups most similar to Immigrants from Western Asia are Cree (5.6%, a difference of 0.16%), Immigrants from Uzbekistan (5.6%, a difference of 0.20%), Immigrants from Syria (5.6%, a difference of 0.49%), Assyrian/Chaldean/Syriac (5.6%, a difference of 0.56%), and Cajun (5.7%, a difference of 0.75%). Similarly, the demographic groups most similar to Nepalese are Cape Verdean (5.9%, a difference of 0.11%), Blackfeet (5.9%, a difference of 0.39%), Immigrants from Bahamas (5.8%, a difference of 0.79%), Immigrants from the Azores (5.8%, a difference of 1.2%), and Immigrants from Nigeria (5.8%, a difference of 1.9%).
| Demographics | Rating | Rank | Female Unemployment |
| Immigrants | Western Asia | 1.1 /100 | #247 | Tragic 5.6% |
| Cree | 1.0 /100 | #248 | Tragic 5.6% |
| Immigrants | Uzbekistan | 1.0 /100 | #249 | Tragic 5.6% |
| Immigrants | Syria | 0.8 /100 | #250 | Tragic 5.6% |
| Assyrians/Chaldeans/Syriacs | 0.8 /100 | #251 | Tragic 5.6% |
| Cajuns | 0.7 /100 | #252 | Tragic 5.7% |
| Immigrants | Sierra Leone | 0.6 /100 | #253 | Tragic 5.7% |
| Immigrants | Immigrants | 0.6 /100 | #254 | Tragic 5.7% |
| Immigrants | Cameroon | 0.6 /100 | #255 | Tragic 5.7% |
| Sub-Saharan Africans | 0.4 /100 | #256 | Tragic 5.7% |
| Dutch West Indians | 0.3 /100 | #257 | Tragic 5.7% |
| Immigrants | Portugal | 0.2 /100 | #258 | Tragic 5.8% |
| Immigrants | Fiji | 0.2 /100 | #259 | Tragic 5.8% |
| Nigerians | 0.2 /100 | #260 | Tragic 5.8% |
| Kiowa | 0.1 /100 | #261 | Tragic 5.8% |
| Immigrants | Nigeria | 0.1 /100 | #262 | Tragic 5.8% |
| Immigrants | Azores | 0.1 /100 | #263 | Tragic 5.8% |
| Immigrants | Bahamas | 0.1 /100 | #264 | Tragic 5.8% |
| Blackfeet | 0.0 /100 | #265 | Tragic 5.9% |
| Cape Verdeans | 0.0 /100 | #266 | Tragic 5.9% |
| Nepalese | 0.0 /100 | #267 | Tragic 5.9% |