Bolivian vs Immigrants from Congo Female Unemployment
COMPARE
Bolivian
Immigrants from Congo
Female Unemployment
Female Unemployment Comparison
Bolivians
Immigrants from Congo
5.0%
FEMALE UNEMPLOYMENT
97.1/ 100
METRIC RATING
86th/ 347
METRIC RANK
5.3%
FEMALE UNEMPLOYMENT
43.1/ 100
METRIC RATING
180th/ 347
METRIC RANK
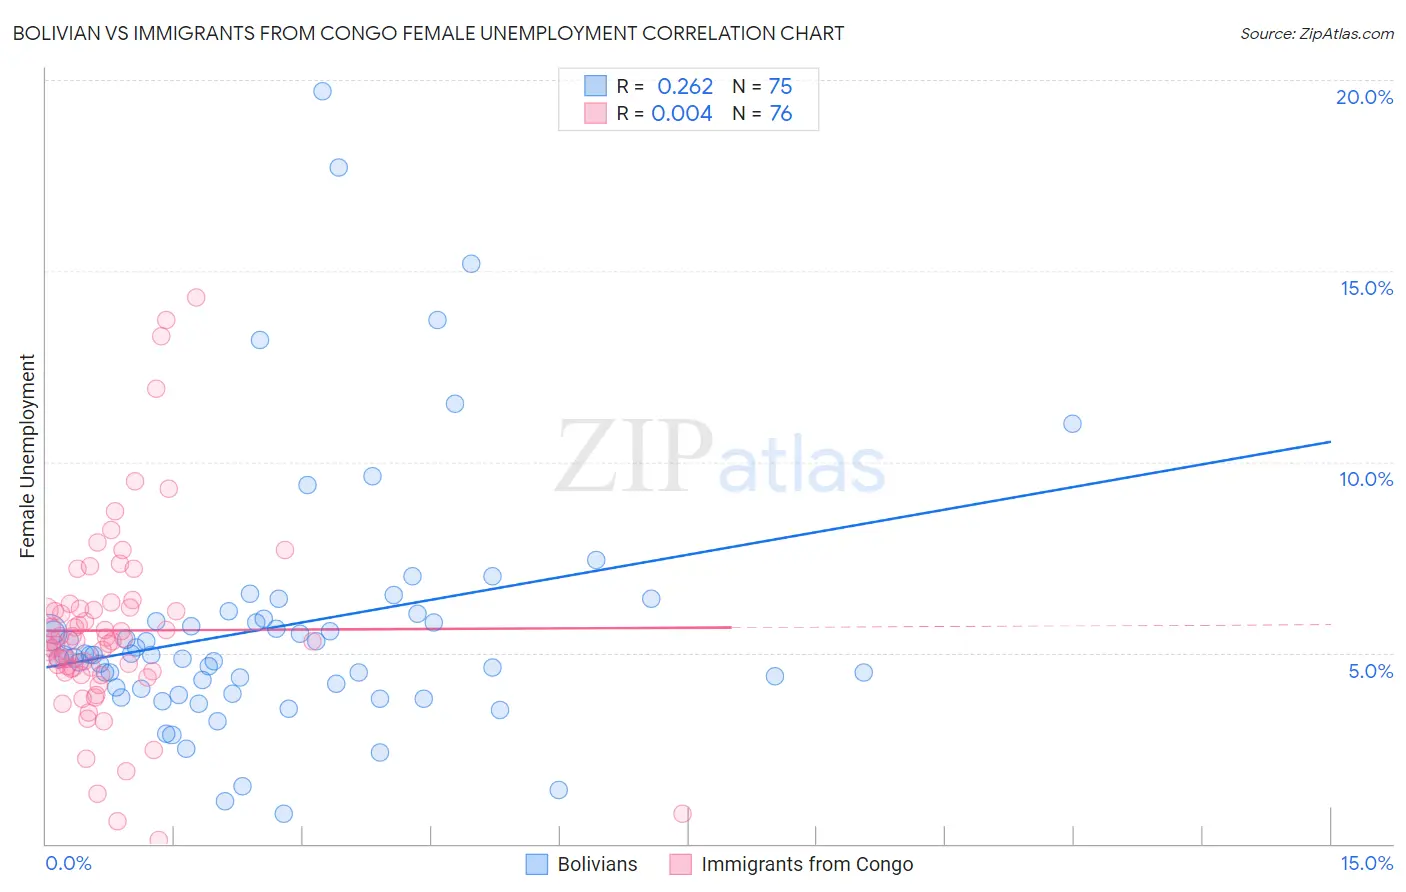
Bolivian vs Immigrants from Congo Female Unemployment Correlation Chart
The statistical analysis conducted on geographies consisting of 184,486,033 people shows a weak positive correlation between the proportion of Bolivians and unemploymnet rate among females in the United States with a correlation coefficient (R) of 0.262 and weighted average of 5.0%. Similarly, the statistical analysis conducted on geographies consisting of 92,074,429 people shows no correlation between the proportion of Immigrants from Congo and unemploymnet rate among females in the United States with a correlation coefficient (R) of 0.004 and weighted average of 5.3%, a difference of 6.0%.
Female Unemployment Correlation Summary
| Measurement | Bolivian | Immigrants from Congo |
| Minimum | 0.80% | 0.10% |
| Maximum | 19.7% | 14.3% |
| Range | 18.9% | 14.2% |
| Mean | 5.7% | 5.6% |
| Median | 4.9% | 5.3% |
| Interquartile 25% (IQ1) | 4.1% | 4.5% |
| Interquartile 75% (IQ3) | 5.9% | 6.2% |
| Interquartile Range (IQR) | 1.8% | 1.7% |
| Standard Deviation (Sample) | 3.4% | 2.6% |
| Standard Deviation (Population) | 3.3% | 2.5% |
Similar Demographics by Female Unemployment
Demographics Similar to Bolivians by Female Unemployment
In terms of female unemployment, the demographic groups most similar to Bolivians are Ukrainian (5.0%, a difference of 0.010%), Canadian (5.0%, a difference of 0.050%), Immigrants from Serbia (5.0%, a difference of 0.090%), Venezuelan (5.0%, a difference of 0.090%), and Immigrants from Australia (5.0%, a difference of 0.11%).
| Demographics | Rating | Rank | Female Unemployment |
| Turks | 97.6 /100 | #79 | Exceptional 5.0% |
| New Zealanders | 97.4 /100 | #80 | Exceptional 5.0% |
| Filipinos | 97.3 /100 | #81 | Exceptional 5.0% |
| Immigrants | Australia | 97.3 /100 | #82 | Exceptional 5.0% |
| Immigrants | Serbia | 97.2 /100 | #83 | Exceptional 5.0% |
| Canadians | 97.2 /100 | #84 | Exceptional 5.0% |
| Ukrainians | 97.1 /100 | #85 | Exceptional 5.0% |
| Bolivians | 97.1 /100 | #86 | Exceptional 5.0% |
| Venezuelans | 96.9 /100 | #87 | Exceptional 5.0% |
| Immigrants | Sudan | 96.7 /100 | #88 | Exceptional 5.0% |
| Immigrants | Taiwan | 96.6 /100 | #89 | Exceptional 5.0% |
| Immigrants | Sweden | 96.3 /100 | #90 | Exceptional 5.0% |
| Immigrants | Japan | 96.0 /100 | #91 | Exceptional 5.0% |
| Romanians | 95.9 /100 | #92 | Exceptional 5.0% |
| Immigrants | Austria | 95.7 /100 | #93 | Exceptional 5.0% |
Demographics Similar to Immigrants from Congo by Female Unemployment
In terms of female unemployment, the demographic groups most similar to Immigrants from Congo are Taiwanese (5.3%, a difference of 0.020%), Nonimmigrants (5.3%, a difference of 0.030%), Laotian (5.3%, a difference of 0.12%), Immigrants from Indonesia (5.3%, a difference of 0.15%), and Immigrants from Ukraine (5.3%, a difference of 0.18%).
| Demographics | Rating | Rank | Female Unemployment |
| Iranians | 50.4 /100 | #173 | Average 5.3% |
| Immigrants | Poland | 50.0 /100 | #174 | Average 5.3% |
| Immigrants | Laos | 47.5 /100 | #175 | Average 5.3% |
| Immigrants | Vietnam | 47.5 /100 | #176 | Average 5.3% |
| Immigrants | Morocco | 47.4 /100 | #177 | Average 5.3% |
| Immigrants | Southern Europe | 46.2 /100 | #178 | Average 5.3% |
| Laotians | 45.1 /100 | #179 | Average 5.3% |
| Immigrants | Congo | 43.1 /100 | #180 | Average 5.3% |
| Taiwanese | 42.7 /100 | #181 | Average 5.3% |
| Immigrants | Nonimmigrants | 42.6 /100 | #182 | Average 5.3% |
| Immigrants | Indonesia | 40.7 /100 | #183 | Average 5.3% |
| Immigrants | Ukraine | 40.1 /100 | #184 | Average 5.3% |
| Malaysians | 40.1 /100 | #185 | Average 5.3% |
| Immigrants | Belarus | 39.4 /100 | #186 | Fair 5.3% |
| Immigrants | Albania | 35.4 /100 | #187 | Fair 5.3% |