Liberian vs Nonimmigrants Unemployment Among Women with Children Ages 6 to 17 years
COMPARE
Liberian
Nonimmigrants
Unemployment Among Women with Children Ages 6 to 17 years
Unemployment Among Women with Children Ages 6 to 17 years Comparison
Liberians
Nonimmigrants
10.8%
UNEMPLOYMENT AMONG WOMEN WITH CHILDREN AGES 6 TO 17 YEARS
0.0/ 100
METRIC RATING
326th/ 347
METRIC RANK
10.0%
UNEMPLOYMENT AMONG WOMEN WITH CHILDREN AGES 6 TO 17 YEARS
0.0/ 100
METRIC RATING
291st/ 347
METRIC RANK
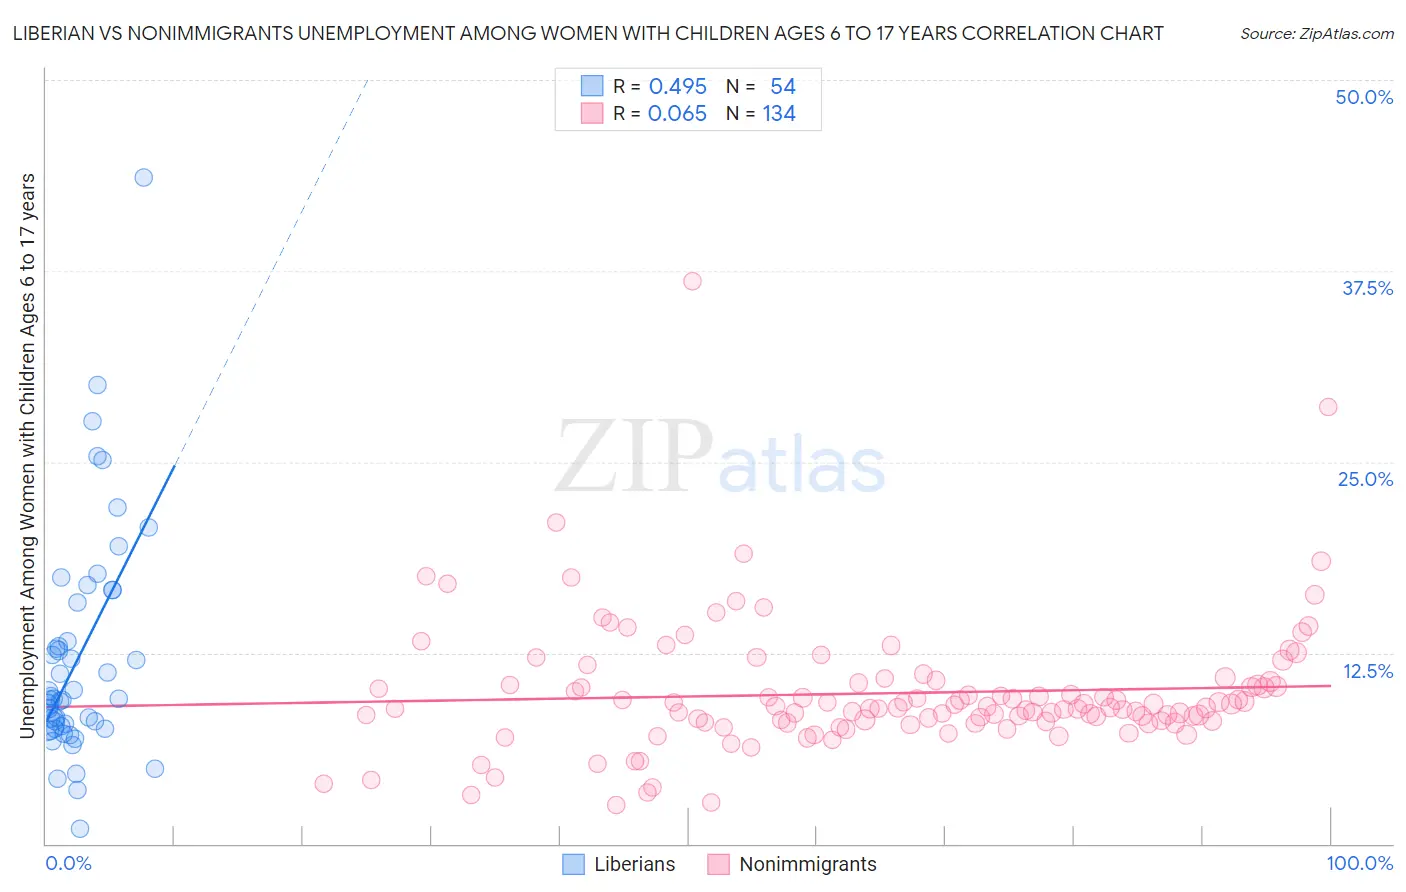
Liberian vs Nonimmigrants Unemployment Among Women with Children Ages 6 to 17 years Correlation Chart
The statistical analysis conducted on geographies consisting of 103,141,134 people shows a moderate positive correlation between the proportion of Liberians and unemployment rate among women with children between the ages 6 and 17 in the United States with a correlation coefficient (R) of 0.495 and weighted average of 10.8%. Similarly, the statistical analysis conducted on geographies consisting of 361,515,464 people shows a slight positive correlation between the proportion of Nonimmigrants and unemployment rate among women with children between the ages 6 and 17 in the United States with a correlation coefficient (R) of 0.065 and weighted average of 10.0%, a difference of 8.4%.
Unemployment Among Women with Children Ages 6 to 17 years Correlation Summary
| Measurement | Liberian | Nonimmigrants |
| Minimum | 1.0% | 2.6% |
| Maximum | 43.6% | 36.8% |
| Range | 42.6% | 34.3% |
| Mean | 12.2% | 9.9% |
| Median | 9.5% | 8.9% |
| Interquartile 25% (IQ1) | 7.7% | 8.0% |
| Interquartile 75% (IQ3) | 15.8% | 10.5% |
| Interquartile Range (IQR) | 8.1% | 2.5% |
| Standard Deviation (Sample) | 7.6% | 4.3% |
| Standard Deviation (Population) | 7.5% | 4.3% |
Similar Demographics by Unemployment Among Women with Children Ages 6 to 17 years
Demographics Similar to Liberians by Unemployment Among Women with Children Ages 6 to 17 years
In terms of unemployment among women with children ages 6 to 17 years, the demographic groups most similar to Liberians are Cajun (10.8%, a difference of 0.070%), Cape Verdean (10.9%, a difference of 0.070%), Ottawa (10.9%, a difference of 0.20%), Immigrants from Dominican Republic (10.8%, a difference of 0.25%), and Dominican (10.8%, a difference of 0.31%).
| Demographics | Rating | Rank | Unemployment Among Women with Children Ages 6 to 17 years |
| Immigrants | Uganda | 0.0 /100 | #319 | Tragic 10.7% |
| Apache | 0.0 /100 | #320 | Tragic 10.7% |
| Tohono O'odham | 0.0 /100 | #321 | Tragic 10.7% |
| Cree | 0.0 /100 | #322 | Tragic 10.8% |
| Dominicans | 0.0 /100 | #323 | Tragic 10.8% |
| Immigrants | Dominican Republic | 0.0 /100 | #324 | Tragic 10.8% |
| Cajuns | 0.0 /100 | #325 | Tragic 10.8% |
| Liberians | 0.0 /100 | #326 | Tragic 10.8% |
| Cape Verdeans | 0.0 /100 | #327 | Tragic 10.9% |
| Ottawa | 0.0 /100 | #328 | Tragic 10.9% |
| Pennsylvania Germans | 0.0 /100 | #329 | Tragic 11.0% |
| Chippewa | 0.0 /100 | #330 | Tragic 11.1% |
| Blacks/African Americans | 0.0 /100 | #331 | Tragic 11.4% |
| Tsimshian | 0.0 /100 | #332 | Tragic 11.4% |
| Natives/Alaskans | 0.0 /100 | #333 | Tragic 11.5% |
Demographics Similar to Nonimmigrants by Unemployment Among Women with Children Ages 6 to 17 years
In terms of unemployment among women with children ages 6 to 17 years, the demographic groups most similar to Nonimmigrants are Carpatho Rusyn (10.0%, a difference of 0.010%), Subsaharan African (10.0%, a difference of 0.020%), Honduran (10.0%, a difference of 0.040%), Haitian (10.0%, a difference of 0.10%), and Ecuadorian (10.0%, a difference of 0.19%).
| Demographics | Rating | Rank | Unemployment Among Women with Children Ages 6 to 17 years |
| Yakama | 0.0 /100 | #284 | Tragic 9.9% |
| Hispanics or Latinos | 0.0 /100 | #285 | Tragic 9.9% |
| Choctaw | 0.0 /100 | #286 | Tragic 9.9% |
| Sierra Leoneans | 0.0 /100 | #287 | Tragic 9.9% |
| Shoshone | 0.0 /100 | #288 | Tragic 10.0% |
| Hondurans | 0.0 /100 | #289 | Tragic 10.0% |
| Sub-Saharan Africans | 0.0 /100 | #290 | Tragic 10.0% |
| Immigrants | Nonimmigrants | 0.0 /100 | #291 | Tragic 10.0% |
| Carpatho Rusyns | 0.0 /100 | #292 | Tragic 10.0% |
| Haitians | 0.0 /100 | #293 | Tragic 10.0% |
| Ecuadorians | 0.0 /100 | #294 | Tragic 10.0% |
| Cherokee | 0.0 /100 | #295 | Tragic 10.0% |
| Immigrants | Western Africa | 0.0 /100 | #296 | Tragic 10.1% |
| Immigrants | Caribbean | 0.0 /100 | #297 | Tragic 10.1% |
| Immigrants | Haiti | 0.0 /100 | #298 | Tragic 10.1% |