Immigrants from Thailand vs Nonimmigrants Unemployment Among Women with Children Ages 6 to 17 years
COMPARE
Immigrants from Thailand
Nonimmigrants
Unemployment Among Women with Children Ages 6 to 17 years
Unemployment Among Women with Children Ages 6 to 17 years Comparison
Immigrants from Thailand
Nonimmigrants
8.3%
UNEMPLOYMENT AMONG WOMEN WITH CHILDREN AGES 6 TO 17 YEARS
99.9/ 100
METRIC RATING
69th/ 347
METRIC RANK
10.0%
UNEMPLOYMENT AMONG WOMEN WITH CHILDREN AGES 6 TO 17 YEARS
0.0/ 100
METRIC RATING
291st/ 347
METRIC RANK
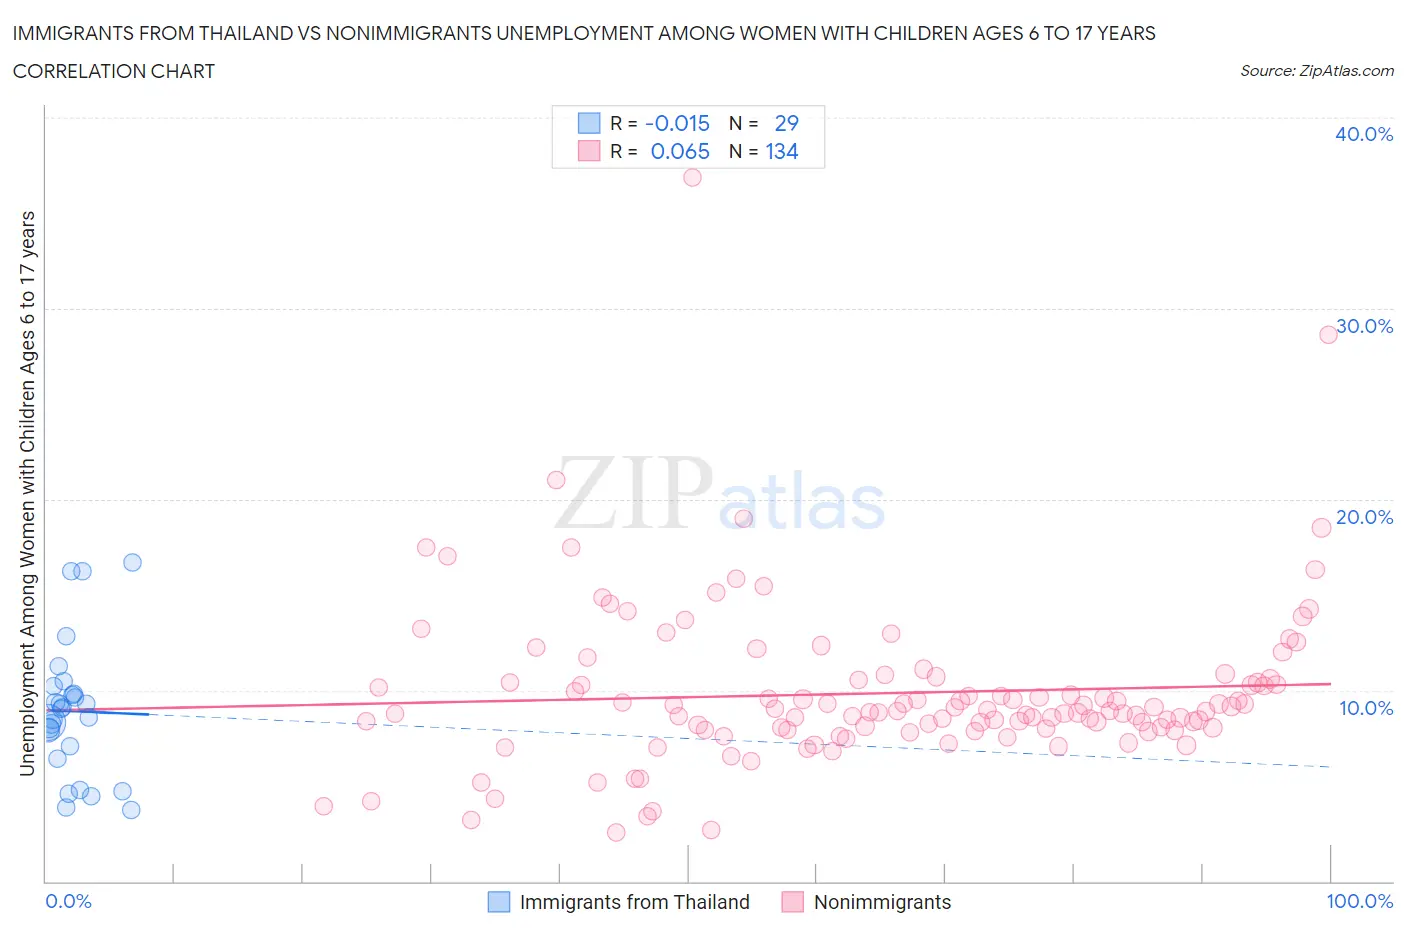
Immigrants from Thailand vs Nonimmigrants Unemployment Among Women with Children Ages 6 to 17 years Correlation Chart
The statistical analysis conducted on geographies consisting of 241,273,781 people shows no correlation between the proportion of Immigrants from Thailand and unemployment rate among women with children between the ages 6 and 17 in the United States with a correlation coefficient (R) of -0.015 and weighted average of 8.3%. Similarly, the statistical analysis conducted on geographies consisting of 361,515,464 people shows a slight positive correlation between the proportion of Nonimmigrants and unemployment rate among women with children between the ages 6 and 17 in the United States with a correlation coefficient (R) of 0.065 and weighted average of 10.0%, a difference of 20.4%.
Unemployment Among Women with Children Ages 6 to 17 years Correlation Summary
| Measurement | Immigrants from Thailand | Nonimmigrants |
| Minimum | 3.7% | 2.6% |
| Maximum | 16.7% | 36.8% |
| Range | 13.0% | 34.3% |
| Mean | 8.9% | 9.9% |
| Median | 9.0% | 8.9% |
| Interquartile 25% (IQ1) | 6.7% | 8.0% |
| Interquartile 75% (IQ3) | 10.0% | 10.5% |
| Interquartile Range (IQR) | 3.2% | 2.5% |
| Standard Deviation (Sample) | 3.5% | 4.3% |
| Standard Deviation (Population) | 3.4% | 4.3% |
Similar Demographics by Unemployment Among Women with Children Ages 6 to 17 years
Demographics Similar to Immigrants from Thailand by Unemployment Among Women with Children Ages 6 to 17 years
In terms of unemployment among women with children ages 6 to 17 years, the demographic groups most similar to Immigrants from Thailand are Marshallese (8.3%, a difference of 0.030%), Norwegian (8.3%, a difference of 0.080%), Armenian (8.3%, a difference of 0.11%), Immigrants from Australia (8.3%, a difference of 0.15%), and Immigrants from Nepal (8.3%, a difference of 0.18%).
| Demographics | Rating | Rank | Unemployment Among Women with Children Ages 6 to 17 years |
| Spanish American Indians | 100.0 /100 | #62 | Exceptional 8.2% |
| Immigrants | South Eastern Asia | 99.9 /100 | #63 | Exceptional 8.2% |
| Immigrants | Kuwait | 99.9 /100 | #64 | Exceptional 8.3% |
| Immigrants | Albania | 99.9 /100 | #65 | Exceptional 8.3% |
| Luxembourgers | 99.9 /100 | #66 | Exceptional 8.3% |
| Armenians | 99.9 /100 | #67 | Exceptional 8.3% |
| Marshallese | 99.9 /100 | #68 | Exceptional 8.3% |
| Immigrants | Thailand | 99.9 /100 | #69 | Exceptional 8.3% |
| Norwegians | 99.9 /100 | #70 | Exceptional 8.3% |
| Immigrants | Australia | 99.8 /100 | #71 | Exceptional 8.3% |
| Immigrants | Nepal | 99.8 /100 | #72 | Exceptional 8.3% |
| Spanish Americans | 99.8 /100 | #73 | Exceptional 8.4% |
| Samoans | 99.7 /100 | #74 | Exceptional 8.4% |
| Immigrants | Sri Lanka | 99.7 /100 | #75 | Exceptional 8.4% |
| Immigrants | Moldova | 99.7 /100 | #76 | Exceptional 8.4% |
Demographics Similar to Nonimmigrants by Unemployment Among Women with Children Ages 6 to 17 years
In terms of unemployment among women with children ages 6 to 17 years, the demographic groups most similar to Nonimmigrants are Carpatho Rusyn (10.0%, a difference of 0.010%), Subsaharan African (10.0%, a difference of 0.020%), Honduran (10.0%, a difference of 0.040%), Haitian (10.0%, a difference of 0.10%), and Ecuadorian (10.0%, a difference of 0.19%).
| Demographics | Rating | Rank | Unemployment Among Women with Children Ages 6 to 17 years |
| Yakama | 0.0 /100 | #284 | Tragic 9.9% |
| Hispanics or Latinos | 0.0 /100 | #285 | Tragic 9.9% |
| Choctaw | 0.0 /100 | #286 | Tragic 9.9% |
| Sierra Leoneans | 0.0 /100 | #287 | Tragic 9.9% |
| Shoshone | 0.0 /100 | #288 | Tragic 10.0% |
| Hondurans | 0.0 /100 | #289 | Tragic 10.0% |
| Sub-Saharan Africans | 0.0 /100 | #290 | Tragic 10.0% |
| Immigrants | Nonimmigrants | 0.0 /100 | #291 | Tragic 10.0% |
| Carpatho Rusyns | 0.0 /100 | #292 | Tragic 10.0% |
| Haitians | 0.0 /100 | #293 | Tragic 10.0% |
| Ecuadorians | 0.0 /100 | #294 | Tragic 10.0% |
| Cherokee | 0.0 /100 | #295 | Tragic 10.0% |
| Immigrants | Western Africa | 0.0 /100 | #296 | Tragic 10.1% |
| Immigrants | Caribbean | 0.0 /100 | #297 | Tragic 10.1% |
| Immigrants | Haiti | 0.0 /100 | #298 | Tragic 10.1% |