Kiowa vs Nonimmigrants Unemployment Among Women with Children Ages 6 to 17 years
COMPARE
Kiowa
Nonimmigrants
Unemployment Among Women with Children Ages 6 to 17 years
Unemployment Among Women with Children Ages 6 to 17 years Comparison
Kiowa
Nonimmigrants
9.6%
UNEMPLOYMENT AMONG WOMEN WITH CHILDREN AGES 6 TO 17 YEARS
0.1/ 100
METRIC RATING
272nd/ 347
METRIC RANK
10.0%
UNEMPLOYMENT AMONG WOMEN WITH CHILDREN AGES 6 TO 17 YEARS
0.0/ 100
METRIC RATING
291st/ 347
METRIC RANK
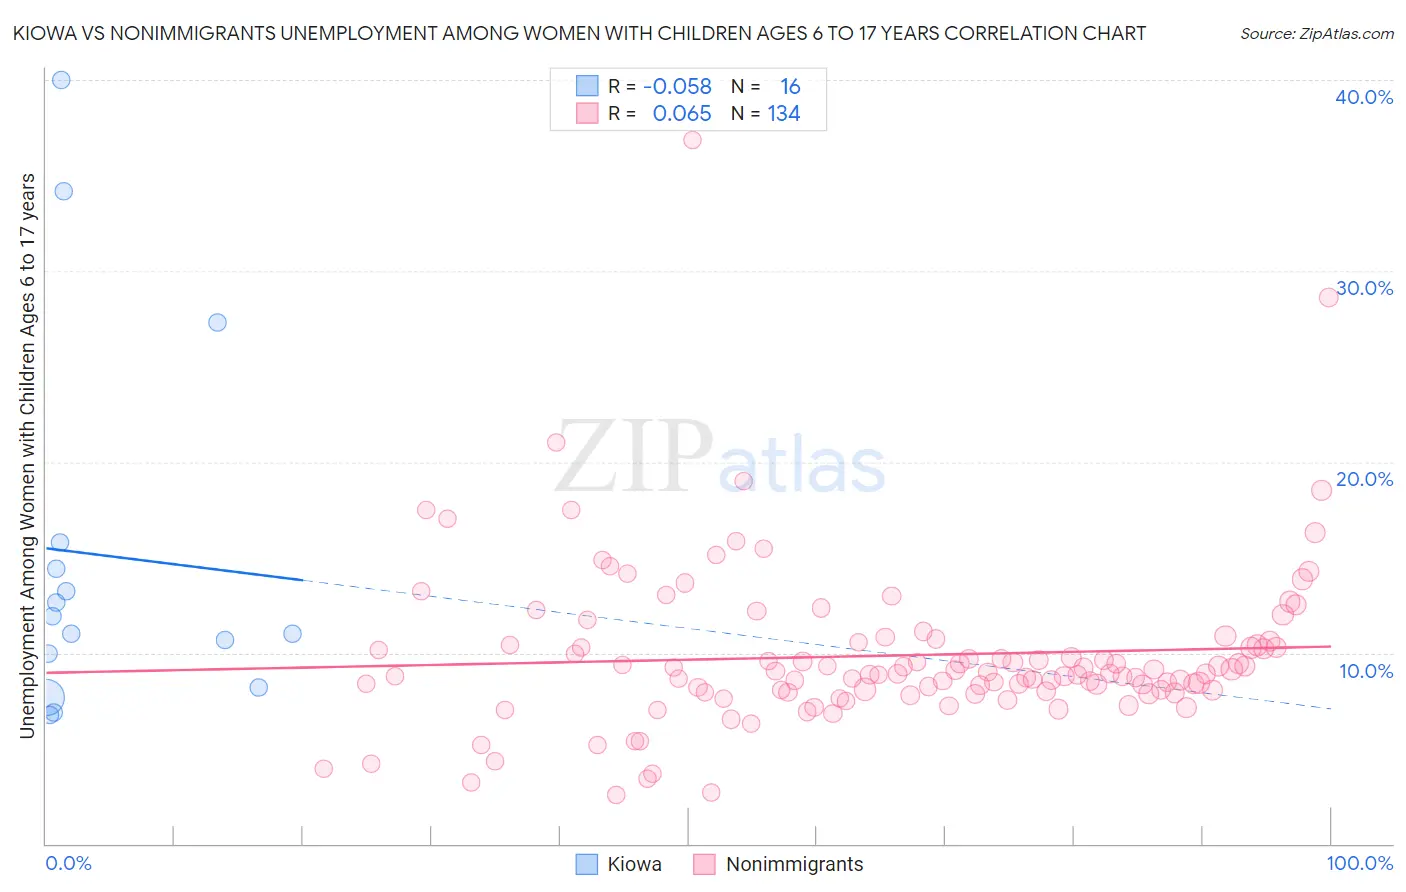
Kiowa vs Nonimmigrants Unemployment Among Women with Children Ages 6 to 17 years Correlation Chart
The statistical analysis conducted on geographies consisting of 51,587,484 people shows a slight negative correlation between the proportion of Kiowa and unemployment rate among women with children between the ages 6 and 17 in the United States with a correlation coefficient (R) of -0.058 and weighted average of 9.6%. Similarly, the statistical analysis conducted on geographies consisting of 361,515,464 people shows a slight positive correlation between the proportion of Nonimmigrants and unemployment rate among women with children between the ages 6 and 17 in the United States with a correlation coefficient (R) of 0.065 and weighted average of 10.0%, a difference of 3.8%.
Unemployment Among Women with Children Ages 6 to 17 years Correlation Summary
| Measurement | Kiowa | Nonimmigrants |
| Minimum | 6.8% | 2.6% |
| Maximum | 40.0% | 36.8% |
| Range | 33.2% | 34.3% |
| Mean | 15.1% | 9.9% |
| Median | 11.5% | 8.9% |
| Interquartile 25% (IQ1) | 9.1% | 8.0% |
| Interquartile 75% (IQ3) | 15.1% | 10.5% |
| Interquartile Range (IQR) | 6.0% | 2.5% |
| Standard Deviation (Sample) | 9.9% | 4.3% |
| Standard Deviation (Population) | 9.6% | 4.3% |
Demographics Similar to Kiowa and Nonimmigrants by Unemployment Among Women with Children Ages 6 to 17 years
In terms of unemployment among women with children ages 6 to 17 years, the demographic groups most similar to Kiowa are White/Caucasian (9.6%, a difference of 0.010%), Immigrants from Latin America (9.6%, a difference of 0.060%), Aleut (9.6%, a difference of 0.060%), U.S. Virgin Islander (9.7%, a difference of 0.50%), and Immigrants from Portugal (9.7%, a difference of 0.50%). Similarly, the demographic groups most similar to Nonimmigrants are Subsaharan African (10.0%, a difference of 0.020%), Honduran (10.0%, a difference of 0.040%), Shoshone (10.0%, a difference of 0.46%), Sierra Leonean (9.9%, a difference of 0.71%), and Choctaw (9.9%, a difference of 0.75%).
| Demographics | Rating | Rank | Unemployment Among Women with Children Ages 6 to 17 years |
| Immigrants | Latin America | 0.1 /100 | #271 | Tragic 9.6% |
| Kiowa | 0.1 /100 | #272 | Tragic 9.6% |
| Whites/Caucasians | 0.1 /100 | #273 | Tragic 9.6% |
| Aleuts | 0.1 /100 | #274 | Tragic 9.6% |
| U.S. Virgin Islanders | 0.1 /100 | #275 | Tragic 9.7% |
| Immigrants | Portugal | 0.1 /100 | #276 | Tragic 9.7% |
| British West Indians | 0.1 /100 | #277 | Tragic 9.7% |
| French | 0.1 /100 | #278 | Tragic 9.7% |
| Scotch-Irish | 0.1 /100 | #279 | Tragic 9.7% |
| Seminole | 0.1 /100 | #280 | Tragic 9.7% |
| Jamaicans | 0.0 /100 | #281 | Tragic 9.8% |
| Slovaks | 0.0 /100 | #282 | Tragic 9.8% |
| Central American Indians | 0.0 /100 | #283 | Tragic 9.9% |
| Yakama | 0.0 /100 | #284 | Tragic 9.9% |
| Hispanics or Latinos | 0.0 /100 | #285 | Tragic 9.9% |
| Choctaw | 0.0 /100 | #286 | Tragic 9.9% |
| Sierra Leoneans | 0.0 /100 | #287 | Tragic 9.9% |
| Shoshone | 0.0 /100 | #288 | Tragic 10.0% |
| Hondurans | 0.0 /100 | #289 | Tragic 10.0% |
| Sub-Saharan Africans | 0.0 /100 | #290 | Tragic 10.0% |
| Immigrants | Nonimmigrants | 0.0 /100 | #291 | Tragic 10.0% |