Liberian vs Immigrants from Grenada Unemployment Among Women with Children Ages 6 to 17 years
COMPARE
Liberian
Immigrants from Grenada
Unemployment Among Women with Children Ages 6 to 17 years
Unemployment Among Women with Children Ages 6 to 17 years Comparison
Liberians
Immigrants from Grenada
10.8%
UNEMPLOYMENT AMONG WOMEN WITH CHILDREN AGES 6 TO 17 YEARS
0.0/ 100
METRIC RATING
326th/ 347
METRIC RANK
8.6%
UNEMPLOYMENT AMONG WOMEN WITH CHILDREN AGES 6 TO 17 YEARS
96.2/ 100
METRIC RATING
119th/ 347
METRIC RANK
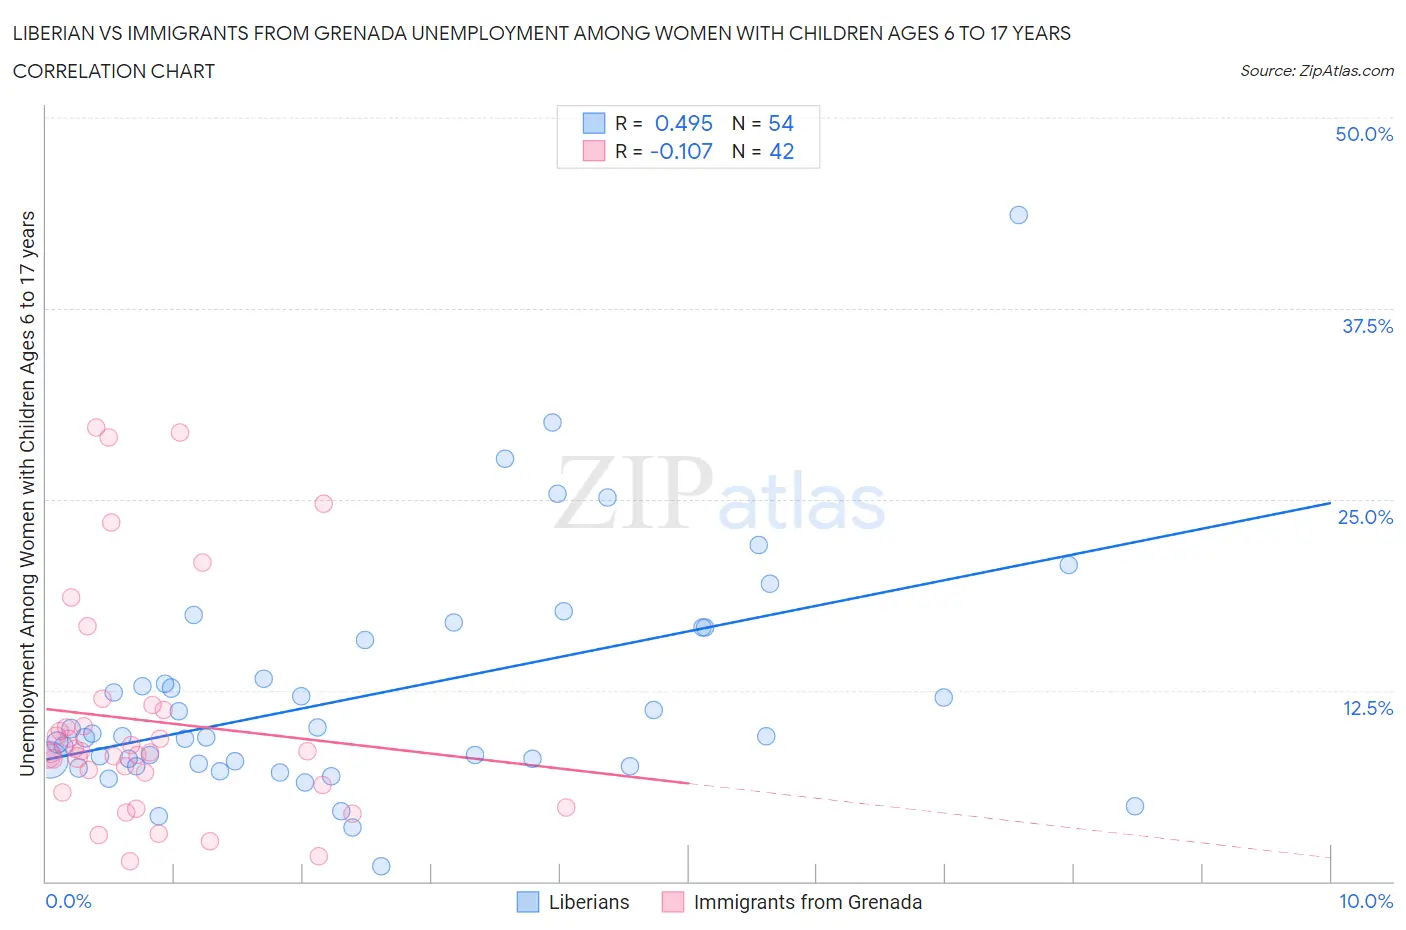
Liberian vs Immigrants from Grenada Unemployment Among Women with Children Ages 6 to 17 years Correlation Chart
The statistical analysis conducted on geographies consisting of 103,141,134 people shows a moderate positive correlation between the proportion of Liberians and unemployment rate among women with children between the ages 6 and 17 in the United States with a correlation coefficient (R) of 0.495 and weighted average of 10.8%. Similarly, the statistical analysis conducted on geographies consisting of 59,147,258 people shows a poor negative correlation between the proportion of Immigrants from Grenada and unemployment rate among women with children between the ages 6 and 17 in the United States with a correlation coefficient (R) of -0.107 and weighted average of 8.6%, a difference of 25.5%.
Unemployment Among Women with Children Ages 6 to 17 years Correlation Summary
| Measurement | Liberian | Immigrants from Grenada |
| Minimum | 1.0% | 1.3% |
| Maximum | 43.6% | 29.7% |
| Range | 42.6% | 28.4% |
| Mean | 12.2% | 10.5% |
| Median | 9.5% | 8.5% |
| Interquartile 25% (IQ1) | 7.7% | 6.3% |
| Interquartile 75% (IQ3) | 15.8% | 11.2% |
| Interquartile Range (IQR) | 8.1% | 4.9% |
| Standard Deviation (Sample) | 7.6% | 7.4% |
| Standard Deviation (Population) | 7.5% | 7.3% |
Similar Demographics by Unemployment Among Women with Children Ages 6 to 17 years
Demographics Similar to Liberians by Unemployment Among Women with Children Ages 6 to 17 years
In terms of unemployment among women with children ages 6 to 17 years, the demographic groups most similar to Liberians are Cajun (10.8%, a difference of 0.070%), Cape Verdean (10.9%, a difference of 0.070%), Ottawa (10.9%, a difference of 0.20%), Immigrants from Dominican Republic (10.8%, a difference of 0.25%), and Dominican (10.8%, a difference of 0.31%).
| Demographics | Rating | Rank | Unemployment Among Women with Children Ages 6 to 17 years |
| Immigrants | Uganda | 0.0 /100 | #319 | Tragic 10.7% |
| Apache | 0.0 /100 | #320 | Tragic 10.7% |
| Tohono O'odham | 0.0 /100 | #321 | Tragic 10.7% |
| Cree | 0.0 /100 | #322 | Tragic 10.8% |
| Dominicans | 0.0 /100 | #323 | Tragic 10.8% |
| Immigrants | Dominican Republic | 0.0 /100 | #324 | Tragic 10.8% |
| Cajuns | 0.0 /100 | #325 | Tragic 10.8% |
| Liberians | 0.0 /100 | #326 | Tragic 10.8% |
| Cape Verdeans | 0.0 /100 | #327 | Tragic 10.9% |
| Ottawa | 0.0 /100 | #328 | Tragic 10.9% |
| Pennsylvania Germans | 0.0 /100 | #329 | Tragic 11.0% |
| Chippewa | 0.0 /100 | #330 | Tragic 11.1% |
| Blacks/African Americans | 0.0 /100 | #331 | Tragic 11.4% |
| Tsimshian | 0.0 /100 | #332 | Tragic 11.4% |
| Natives/Alaskans | 0.0 /100 | #333 | Tragic 11.5% |
Demographics Similar to Immigrants from Grenada by Unemployment Among Women with Children Ages 6 to 17 years
In terms of unemployment among women with children ages 6 to 17 years, the demographic groups most similar to Immigrants from Grenada are Pueblo (8.6%, a difference of 0.010%), Albanian (8.6%, a difference of 0.040%), Zimbabwean (8.6%, a difference of 0.050%), Israeli (8.7%, a difference of 0.080%), and Argentinean (8.6%, a difference of 0.12%).
| Demographics | Rating | Rank | Unemployment Among Women with Children Ages 6 to 17 years |
| Romanians | 97.1 /100 | #112 | Exceptional 8.6% |
| Eastern Europeans | 96.8 /100 | #113 | Exceptional 8.6% |
| Immigrants | Russia | 96.7 /100 | #114 | Exceptional 8.6% |
| Argentineans | 96.5 /100 | #115 | Exceptional 8.6% |
| Zimbabweans | 96.3 /100 | #116 | Exceptional 8.6% |
| Albanians | 96.3 /100 | #117 | Exceptional 8.6% |
| Pueblo | 96.2 /100 | #118 | Exceptional 8.6% |
| Immigrants | Grenada | 96.2 /100 | #119 | Exceptional 8.6% |
| Israelis | 95.9 /100 | #120 | Exceptional 8.7% |
| Immigrants | Denmark | 95.5 /100 | #121 | Exceptional 8.7% |
| Immigrants | Egypt | 95.0 /100 | #122 | Exceptional 8.7% |
| Immigrants | Morocco | 94.9 /100 | #123 | Exceptional 8.7% |
| Immigrants | Lebanon | 94.9 /100 | #124 | Exceptional 8.7% |
| South Africans | 94.6 /100 | #125 | Exceptional 8.7% |
| Immigrants | Northern Africa | 94.4 /100 | #126 | Exceptional 8.7% |