Liberian vs Immigrants from Germany Unemployment Among Women with Children Ages 6 to 17 years
COMPARE
Liberian
Immigrants from Germany
Unemployment Among Women with Children Ages 6 to 17 years
Unemployment Among Women with Children Ages 6 to 17 years Comparison
Liberians
Immigrants from Germany
10.8%
UNEMPLOYMENT AMONG WOMEN WITH CHILDREN AGES 6 TO 17 YEARS
0.0/ 100
METRIC RATING
326th/ 347
METRIC RANK
9.2%
UNEMPLOYMENT AMONG WOMEN WITH CHILDREN AGES 6 TO 17 YEARS
7.2/ 100
METRIC RATING
215th/ 347
METRIC RANK
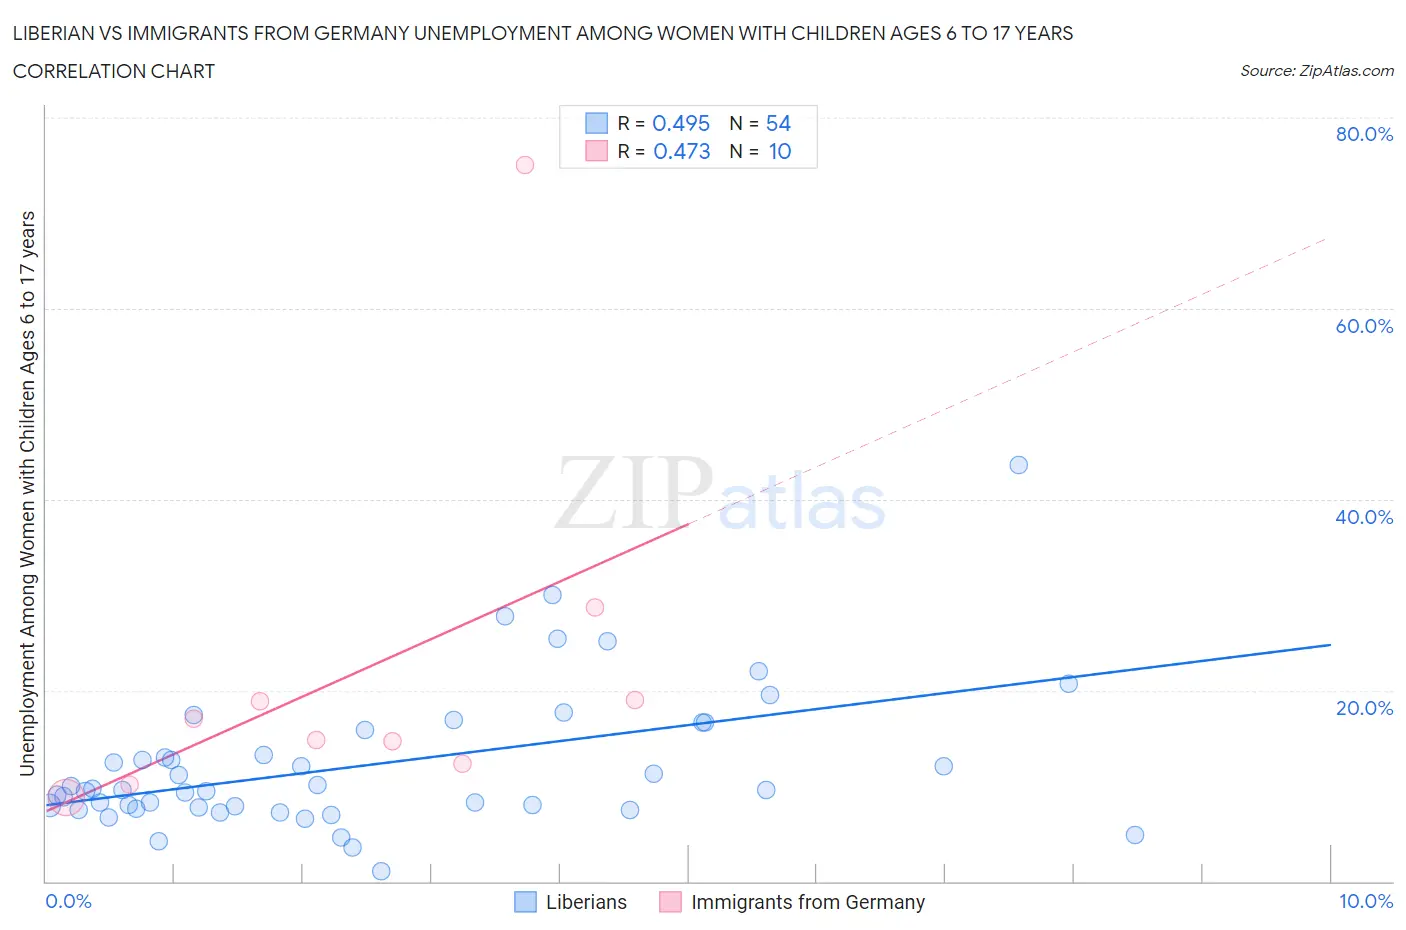
Liberian vs Immigrants from Germany Unemployment Among Women with Children Ages 6 to 17 years Correlation Chart
The statistical analysis conducted on geographies consisting of 103,141,134 people shows a moderate positive correlation between the proportion of Liberians and unemployment rate among women with children between the ages 6 and 17 in the United States with a correlation coefficient (R) of 0.495 and weighted average of 10.8%. Similarly, the statistical analysis conducted on geographies consisting of 317,293,448 people shows a moderate positive correlation between the proportion of Immigrants from Germany and unemployment rate among women with children between the ages 6 and 17 in the United States with a correlation coefficient (R) of 0.473 and weighted average of 9.2%, a difference of 17.7%.
Unemployment Among Women with Children Ages 6 to 17 years Correlation Summary
| Measurement | Liberian | Immigrants from Germany |
| Minimum | 1.0% | 8.7% |
| Maximum | 43.6% | 75.1% |
| Range | 42.6% | 66.3% |
| Mean | 12.2% | 21.9% |
| Median | 9.5% | 15.9% |
| Interquartile 25% (IQ1) | 7.7% | 12.3% |
| Interquartile 75% (IQ3) | 15.8% | 19.0% |
| Interquartile Range (IQR) | 8.1% | 6.7% |
| Standard Deviation (Sample) | 7.6% | 19.5% |
| Standard Deviation (Population) | 7.5% | 18.5% |
Similar Demographics by Unemployment Among Women with Children Ages 6 to 17 years
Demographics Similar to Liberians by Unemployment Among Women with Children Ages 6 to 17 years
In terms of unemployment among women with children ages 6 to 17 years, the demographic groups most similar to Liberians are Cajun (10.8%, a difference of 0.070%), Cape Verdean (10.9%, a difference of 0.070%), Ottawa (10.9%, a difference of 0.20%), Immigrants from Dominican Republic (10.8%, a difference of 0.25%), and Dominican (10.8%, a difference of 0.31%).
| Demographics | Rating | Rank | Unemployment Among Women with Children Ages 6 to 17 years |
| Immigrants | Uganda | 0.0 /100 | #319 | Tragic 10.7% |
| Apache | 0.0 /100 | #320 | Tragic 10.7% |
| Tohono O'odham | 0.0 /100 | #321 | Tragic 10.7% |
| Cree | 0.0 /100 | #322 | Tragic 10.8% |
| Dominicans | 0.0 /100 | #323 | Tragic 10.8% |
| Immigrants | Dominican Republic | 0.0 /100 | #324 | Tragic 10.8% |
| Cajuns | 0.0 /100 | #325 | Tragic 10.8% |
| Liberians | 0.0 /100 | #326 | Tragic 10.8% |
| Cape Verdeans | 0.0 /100 | #327 | Tragic 10.9% |
| Ottawa | 0.0 /100 | #328 | Tragic 10.9% |
| Pennsylvania Germans | 0.0 /100 | #329 | Tragic 11.0% |
| Chippewa | 0.0 /100 | #330 | Tragic 11.1% |
| Blacks/African Americans | 0.0 /100 | #331 | Tragic 11.4% |
| Tsimshian | 0.0 /100 | #332 | Tragic 11.4% |
| Natives/Alaskans | 0.0 /100 | #333 | Tragic 11.5% |
Demographics Similar to Immigrants from Germany by Unemployment Among Women with Children Ages 6 to 17 years
In terms of unemployment among women with children ages 6 to 17 years, the demographic groups most similar to Immigrants from Germany are Immigrants from Uruguay (9.2%, a difference of 0.0%), German (9.2%, a difference of 0.010%), Iroquois (9.2%, a difference of 0.040%), Syrian (9.2%, a difference of 0.060%), and Immigrants from Scotland (9.2%, a difference of 0.11%).
| Demographics | Rating | Rank | Unemployment Among Women with Children Ages 6 to 17 years |
| Immigrants | Peru | 10.8 /100 | #208 | Poor 9.2% |
| Salvadorans | 10.7 /100 | #209 | Poor 9.2% |
| Finns | 10.0 /100 | #210 | Tragic 9.2% |
| Immigrants | Cuba | 9.6 /100 | #211 | Tragic 9.2% |
| Peruvians | 9.0 /100 | #212 | Tragic 9.2% |
| Spaniards | 8.2 /100 | #213 | Tragic 9.2% |
| Iroquois | 7.5 /100 | #214 | Tragic 9.2% |
| Immigrants | Germany | 7.2 /100 | #215 | Tragic 9.2% |
| Immigrants | Uruguay | 7.2 /100 | #216 | Tragic 9.2% |
| Germans | 7.2 /100 | #217 | Tragic 9.2% |
| Syrians | 6.9 /100 | #218 | Tragic 9.2% |
| Immigrants | Scotland | 6.6 /100 | #219 | Tragic 9.2% |
| Belgians | 6.4 /100 | #220 | Tragic 9.2% |
| Crow | 5.8 /100 | #221 | Tragic 9.2% |
| Immigrants | Southern Europe | 5.8 /100 | #222 | Tragic 9.2% |