Hawaiian vs Immigrants from Denmark Unemployment Among Women with Children Under 6 years
COMPARE
Hawaiian
Immigrants from Denmark
Unemployment Among Women with Children Under 6 years
Unemployment Among Women with Children Under 6 years Comparison
Hawaiians
Immigrants from Denmark
8.2%
UNEMPLOYMENT AMONG WOMEN WITH CHILDREN UNDER 6 YEARS
1.8/ 100
METRIC RATING
243rd/ 347
METRIC RANK
7.1%
UNEMPLOYMENT AMONG WOMEN WITH CHILDREN UNDER 6 YEARS
98.3/ 100
METRIC RATING
89th/ 347
METRIC RANK
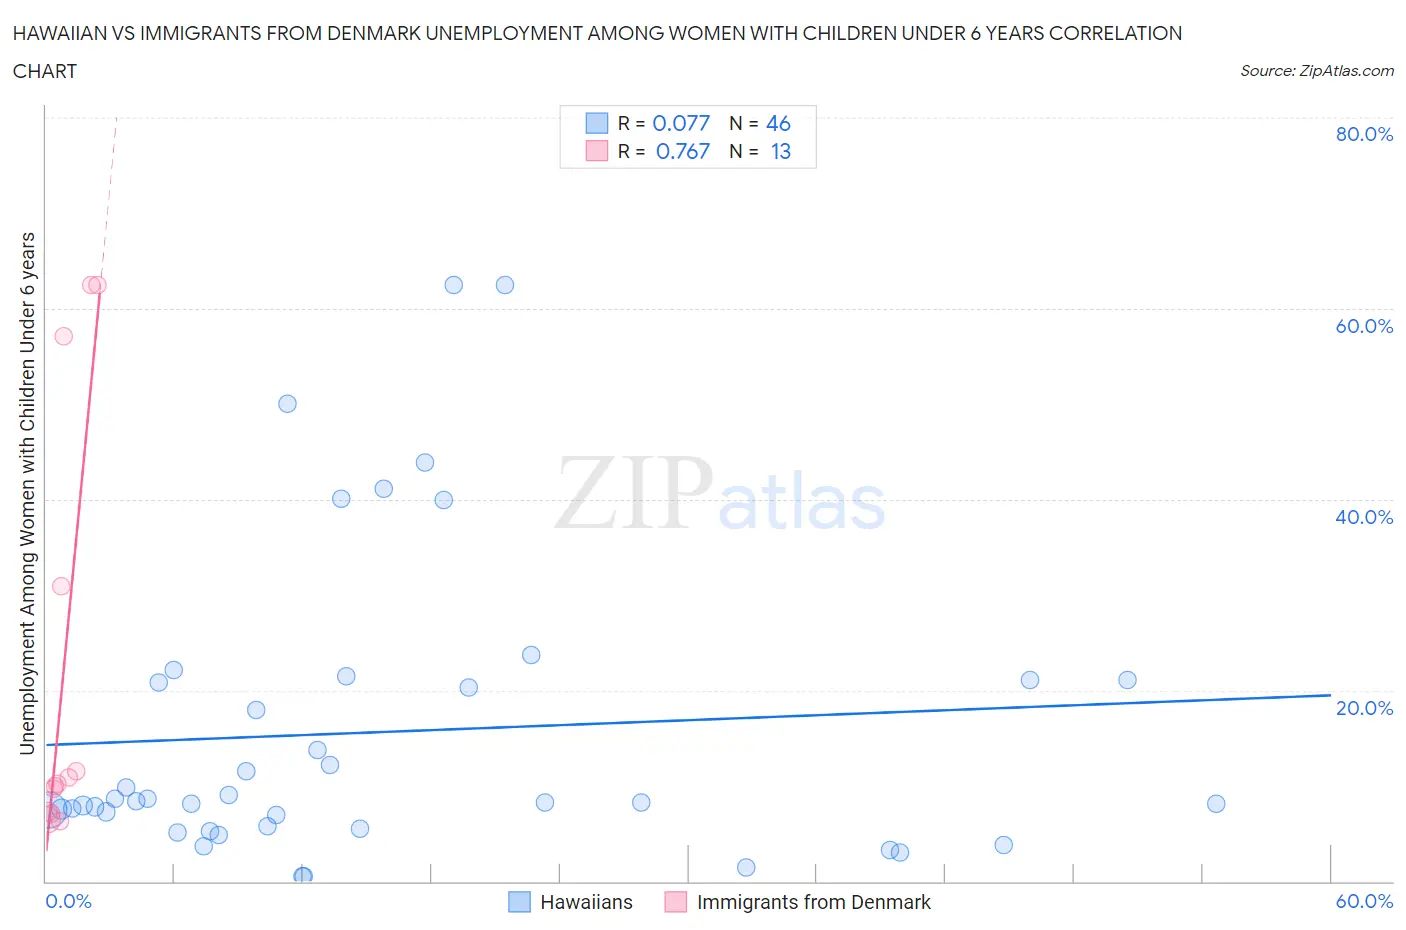
Hawaiian vs Immigrants from Denmark Unemployment Among Women with Children Under 6 years Correlation Chart
The statistical analysis conducted on geographies consisting of 261,346,546 people shows a slight positive correlation between the proportion of Hawaiians and unemployment rate among women with children under the age of 6 in the United States with a correlation coefficient (R) of 0.077 and weighted average of 8.2%. Similarly, the statistical analysis conducted on geographies consisting of 117,608,008 people shows a strong positive correlation between the proportion of Immigrants from Denmark and unemployment rate among women with children under the age of 6 in the United States with a correlation coefficient (R) of 0.767 and weighted average of 7.1%, a difference of 14.3%.
Unemployment Among Women with Children Under 6 years Correlation Summary
| Measurement | Hawaiian | Immigrants from Denmark |
| Minimum | 0.50% | 6.3% |
| Maximum | 62.5% | 62.5% |
| Range | 62.0% | 56.2% |
| Mean | 15.6% | 22.5% |
| Median | 8.3% | 10.3% |
| Interquartile 25% (IQ1) | 5.8% | 7.2% |
| Interquartile 75% (IQ3) | 21.1% | 44.0% |
| Interquartile Range (IQR) | 15.3% | 36.8% |
| Standard Deviation (Sample) | 15.8% | 22.7% |
| Standard Deviation (Population) | 15.6% | 21.8% |
Similar Demographics by Unemployment Among Women with Children Under 6 years
Demographics Similar to Hawaiians by Unemployment Among Women with Children Under 6 years
In terms of unemployment among women with children under 6 years, the demographic groups most similar to Hawaiians are French (8.2%, a difference of 0.030%), Native Hawaiian (8.2%, a difference of 0.040%), Central American (8.2%, a difference of 0.37%), Dutch (8.1%, a difference of 0.56%), and Liberian (8.1%, a difference of 0.61%).
| Demographics | Rating | Rank | Unemployment Among Women with Children Under 6 years |
| Immigrants | Barbados | 4.2 /100 | #236 | Tragic 8.0% |
| Immigrants | Costa Rica | 4.1 /100 | #237 | Tragic 8.0% |
| Immigrants | Middle Africa | 3.2 /100 | #238 | Tragic 8.1% |
| Irish | 2.7 /100 | #239 | Tragic 8.1% |
| Immigrants | El Salvador | 2.6 /100 | #240 | Tragic 8.1% |
| Liberians | 2.6 /100 | #241 | Tragic 8.1% |
| Dutch | 2.5 /100 | #242 | Tragic 8.1% |
| Hawaiians | 1.8 /100 | #243 | Tragic 8.2% |
| French | 1.7 /100 | #244 | Tragic 8.2% |
| Native Hawaiians | 1.7 /100 | #245 | Tragic 8.2% |
| Central Americans | 1.4 /100 | #246 | Tragic 8.2% |
| German Russians | 1.2 /100 | #247 | Tragic 8.2% |
| Immigrants | Western Africa | 1.1 /100 | #248 | Tragic 8.2% |
| Immigrants | Sierra Leone | 1.1 /100 | #249 | Tragic 8.2% |
| Nigerians | 1.1 /100 | #250 | Tragic 8.2% |
Demographics Similar to Immigrants from Denmark by Unemployment Among Women with Children Under 6 years
In terms of unemployment among women with children under 6 years, the demographic groups most similar to Immigrants from Denmark are Immigrants from Hungary (7.1%, a difference of 0.040%), Immigrants from Spain (7.1%, a difference of 0.050%), Danish (7.1%, a difference of 0.12%), Alsatian (7.1%, a difference of 0.16%), and Albanian (7.2%, a difference of 0.25%).
| Demographics | Rating | Rank | Unemployment Among Women with Children Under 6 years |
| Immigrants | Afghanistan | 98.7 /100 | #82 | Exceptional 7.1% |
| Egyptians | 98.7 /100 | #83 | Exceptional 7.1% |
| Immigrants | Albania | 98.7 /100 | #84 | Exceptional 7.1% |
| Immigrants | Romania | 98.7 /100 | #85 | Exceptional 7.1% |
| Immigrants | Zimbabwe | 98.6 /100 | #86 | Exceptional 7.1% |
| Alsatians | 98.4 /100 | #87 | Exceptional 7.1% |
| Immigrants | Hungary | 98.3 /100 | #88 | Exceptional 7.1% |
| Immigrants | Denmark | 98.3 /100 | #89 | Exceptional 7.1% |
| Immigrants | Spain | 98.2 /100 | #90 | Exceptional 7.1% |
| Danes | 98.2 /100 | #91 | Exceptional 7.1% |
| Albanians | 98.0 /100 | #92 | Exceptional 7.2% |
| New Zealanders | 97.8 /100 | #93 | Exceptional 7.2% |
| Macedonians | 97.7 /100 | #94 | Exceptional 7.2% |
| Romanians | 97.7 /100 | #95 | Exceptional 7.2% |
| Immigrants | Eastern Africa | 97.7 /100 | #96 | Exceptional 7.2% |