Lebanese vs Chippewa College, 1 year or more
COMPARE
Lebanese
Chippewa
College, 1 year or more
College, 1 year or more Comparison
Lebanese
Chippewa
61.6%
COLLEGE, 1 YEAR OR MORE
94.1/ 100
METRIC RATING
116th/ 347
METRIC RANK
55.7%
COLLEGE, 1 YEAR OR MORE
0.9/ 100
METRIC RATING
244th/ 347
METRIC RANK
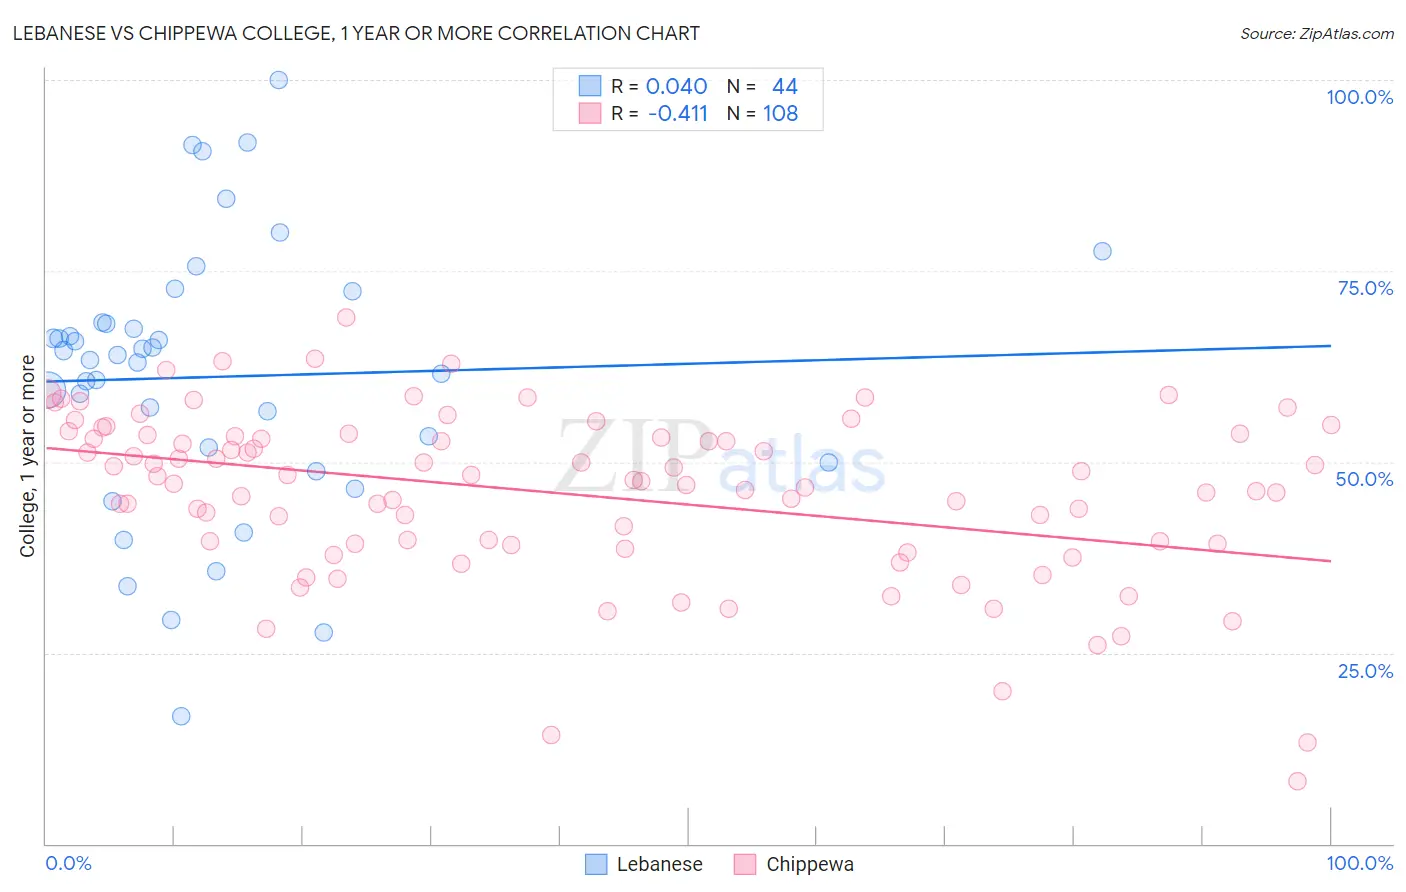
Lebanese vs Chippewa College, 1 year or more Correlation Chart
The statistical analysis conducted on geographies consisting of 401,622,274 people shows no correlation between the proportion of Lebanese and percentage of population with at least college, 1 year or more education in the United States with a correlation coefficient (R) of 0.040 and weighted average of 61.6%. Similarly, the statistical analysis conducted on geographies consisting of 215,068,137 people shows a moderate negative correlation between the proportion of Chippewa and percentage of population with at least college, 1 year or more education in the United States with a correlation coefficient (R) of -0.411 and weighted average of 55.7%, a difference of 10.6%.
College, 1 year or more Correlation Summary
| Measurement | Lebanese | Chippewa |
| Minimum | 16.6% | 8.2% |
| Maximum | 100.0% | 68.9% |
| Range | 83.4% | 60.6% |
| Mean | 61.1% | 45.8% |
| Median | 63.7% | 47.6% |
| Interquartile 25% (IQ1) | 50.9% | 39.3% |
| Interquartile 75% (IQ3) | 68.2% | 53.4% |
| Interquartile Range (IQR) | 17.3% | 14.2% |
| Standard Deviation (Sample) | 17.8% | 11.1% |
| Standard Deviation (Population) | 17.6% | 11.0% |
Similar Demographics by College, 1 year or more
Demographics Similar to Lebanese by College, 1 year or more
In terms of college, 1 year or more, the demographic groups most similar to Lebanese are Arab (61.6%, a difference of 0.040%), Immigrants from Brazil (61.6%, a difference of 0.050%), Norwegian (61.7%, a difference of 0.10%), Danish (61.7%, a difference of 0.17%), and Assyrian/Chaldean/Syriac (61.5%, a difference of 0.18%).
| Demographics | Rating | Rank | College, 1 year or more |
| Immigrants | Northern Africa | 95.7 /100 | #109 | Exceptional 61.9% |
| Europeans | 95.6 /100 | #110 | Exceptional 61.8% |
| Macedonians | 95.6 /100 | #111 | Exceptional 61.8% |
| Austrians | 95.4 /100 | #112 | Exceptional 61.8% |
| Ukrainians | 95.2 /100 | #113 | Exceptional 61.8% |
| Danes | 94.8 /100 | #114 | Exceptional 61.7% |
| Norwegians | 94.5 /100 | #115 | Exceptional 61.7% |
| Lebanese | 94.1 /100 | #116 | Exceptional 61.6% |
| Arabs | 93.9 /100 | #117 | Exceptional 61.6% |
| Immigrants | Brazil | 93.9 /100 | #118 | Exceptional 61.6% |
| Assyrians/Chaldeans/Syriacs | 93.3 /100 | #119 | Exceptional 61.5% |
| Pakistanis | 93.2 /100 | #120 | Exceptional 61.5% |
| Immigrants | Jordan | 92.7 /100 | #121 | Exceptional 61.4% |
| Immigrants | Chile | 92.3 /100 | #122 | Exceptional 61.4% |
| Serbians | 92.2 /100 | #123 | Exceptional 61.4% |
Demographics Similar to Chippewa by College, 1 year or more
In terms of college, 1 year or more, the demographic groups most similar to Chippewa are Immigrants from Liberia (55.7%, a difference of 0.070%), Malaysian (55.6%, a difference of 0.11%), Osage (55.8%, a difference of 0.12%), Marshallese (55.8%, a difference of 0.13%), and Hawaiian (55.6%, a difference of 0.19%).
| Demographics | Rating | Rank | College, 1 year or more |
| Samoans | 1.6 /100 | #237 | Tragic 56.2% |
| Barbadians | 1.3 /100 | #238 | Tragic 56.0% |
| Puget Sound Salish | 1.1 /100 | #239 | Tragic 55.9% |
| Trinidadians and Tobagonians | 1.1 /100 | #240 | Tragic 55.8% |
| French American Indians | 1.0 /100 | #241 | Tragic 55.8% |
| Marshallese | 1.0 /100 | #242 | Tragic 55.8% |
| Osage | 1.0 /100 | #243 | Tragic 55.8% |
| Chippewa | 0.9 /100 | #244 | Tragic 55.7% |
| Immigrants | Liberia | 0.8 /100 | #245 | Tragic 55.7% |
| Malaysians | 0.8 /100 | #246 | Tragic 55.6% |
| Hawaiians | 0.8 /100 | #247 | Tragic 55.6% |
| Immigrants | Congo | 0.8 /100 | #248 | Tragic 55.6% |
| Immigrants | Trinidad and Tobago | 0.7 /100 | #249 | Tragic 55.5% |
| Delaware | 0.7 /100 | #250 | Tragic 55.5% |
| Immigrants | Cambodia | 0.6 /100 | #251 | Tragic 55.4% |