Lebanese vs Immigrants from Central America Unemployment

COMPARE

Lebanese
Race
Ancestry
AfghanAfricanAlaska NativeAlaskan AthabascanAlbanianAleutAlsatianAmericanApacheArabArapahoArgentineanArmenianAssyrian/Chaldean/SyriacAustralianAustrianBahamianBangladeshiBarbadianBasqueBelgianBelizeanBermudanBhutaneseBlackfeetBolivianBrazilianBritishBritish West IndianBulgarianBurmeseCajunCambodianCanadianCape VerdeanCarpatho RusynCelticCentral AmericanCentral American IndianCherokeeCheyenneChickasawChileanChineseChippewaChoctawColombianColvilleComancheCosta RicanCreeCreekCroatianCrowCubanCypriotCzechCzechoslovakianDanishDelawareDominicanDutchDutch West IndianEastern EuropeanEcuadorianEgyptianEnglishEstonianEthiopianEuropeanFijianFilipinoFinnishFrenchFrench American IndianFrench CanadianGermanGerman RussianGhanaianGreekGuamanian/ChamorroGuatemalanGuyaneseHaitianHmongHonduranHopiHoumaHungarianIcelanderIndian (Asian)IndonesianInupiatIranianIraqiIrishIroquoisIsraeliItalianJamaicanJapaneseJordanianKenyanKiowaKoreanLaotianLatvianLebaneseLiberianLithuanianLumbeeLuxembourgerMacedonianMalaysianMalteseMarshalleseMenomineeMexicanMexican American IndianMongolianMoroccanNative HawaiianNavajoNepaleseNew ZealanderNicaraguanNigerianNorthern EuropeanNorwegianOkinawanOsageOttawaPaiutePakistaniPalestinianPanamanianParaguayanPennsylvania GermanPeruvianPimaPolishPortuguesePotawatomiPuebloPuerto RicanPuget Sound SalishRomanianRussianSalvadoranSamoanScandinavianScotch-IrishScottishSeminoleSenegaleseSerbianShoshoneSierra LeoneanSiouxSlavicSlovakSloveneSomaliSouth AfricanSouth AmericanSouth American IndianSoviet UnionSpaniardSpanishSpanish AmericanSpanish American IndianSri LankanSubsaharan AfricanSudaneseSwedishSwissSyrianTaiwaneseThaiTlingit-HaidaTohono O'OdhamTonganTrinidadian and TobagonianTsimshianTurkishU.S. Virgin IslanderUgandanUkrainianUruguayanUteVenezuelanVietnameseWelshWest IndianYakamaYaquiYugoslavianYumanYup'ikZimbabwean
Immigration
NonimmigrantsImmigrantsAfghanistanAfricaAlbaniaArgentinaArmeniaAsiaAustraliaAustriaBahamasBangladeshBarbadosBelarusBelgiumBelizeBoliviaBosnia and HerzegovinaBrazilBulgariaBurma/MyanmarCabo VerdeCambodiaCameroonCanadaCaribbeanChileChinaColombiaCongoCosta RicaCroatiaCubaCzechoslovakiaDenmarkDominicaDominican RepublicEastern AfricaEastern AsiaEastern EuropeEcuadorEgyptEl SalvadorEnglandEritreaEthiopiaEuropeFijiFranceGermanyGhanaGreeceGrenadaGuatemalaGuyanaHaitiHondurasHong KongHungaryIndiaIndonesiaIranIraqIrelandIsraelItalyJamaicaJapanJordanKazakhstanKenyaKoreaKuwaitLaosLatin AmericaLatviaLebanonLiberiaLithuaniaMalaysiaMexicoMicronesiaMiddle AfricaMoldovaMoroccoNepalNetherlandsNicaraguaNigeriaNorth AmericaNorth MacedoniaNorthern AfricaNorthern EuropeNorwayOceaniaPakistanPanamaPeruPhilippinesPolandPortugalRomaniaRussiaSaudi ArabiaScotlandSenegalSerbiaSierra LeoneSingaporeSomaliaSouth AfricaSouth AmericaSouth Central AsiaSouth Eastern AsiaSouthern EuropeSpainSri LankaSt. Vincent and the GrenadinesSudanSwedenSwitzerlandSyriaTaiwanThailandTrinidad and TobagoTurkeyUgandaUkraineUruguayUzbekistanVenezuelaVietnamWest IndiesWestern AfricaWestern AsiaWestern EuropeYemenZaireZimbabweAzores
Immigrants from Central America
Race
Ancestry
AfghanAfricanAlaska NativeAlaskan AthabascanAlbanianAleutAlsatianAmericanApacheArabArapahoArgentineanArmenianAssyrian/Chaldean/SyriacAustralianAustrianBahamianBangladeshiBarbadianBasqueBelgianBelizeanBermudanBhutaneseBlackfeetBolivianBrazilianBritishBritish West IndianBulgarianBurmeseCajunCambodianCanadianCape VerdeanCarpatho RusynCelticCentral AmericanCentral American IndianCherokeeCheyenneChickasawChileanChineseChippewaChoctawColombianColvilleComancheCosta RicanCreeCreekCroatianCrowCubanCypriotCzechCzechoslovakianDanishDelawareDominicanDutchDutch West IndianEastern EuropeanEcuadorianEgyptianEnglishEstonianEthiopianEuropeanFijianFilipinoFinnishFrenchFrench American IndianFrench CanadianGermanGerman RussianGhanaianGreekGuamanian/ChamorroGuatemalanGuyaneseHaitianHmongHonduranHopiHoumaHungarianIcelanderIndian (Asian)IndonesianInupiatIranianIraqiIrishIroquoisIsraeliItalianJamaicanJapaneseJordanianKenyanKiowaKoreanLaotianLatvianLiberianLithuanianLumbeeLuxembourgerMacedonianMalaysianMalteseMarshalleseMenomineeMexicanMexican American IndianMongolianMoroccanNative HawaiianNavajoNepaleseNew ZealanderNicaraguanNigerianNorthern EuropeanNorwegianOkinawanOsageOttawaPaiutePakistaniPalestinianPanamanianParaguayanPennsylvania GermanPeruvianPimaPolishPortuguesePotawatomiPuebloPuerto RicanPuget Sound SalishRomanianRussianSalvadoranSamoanScandinavianScotch-IrishScottishSeminoleSenegaleseSerbianShoshoneSierra LeoneanSiouxSlavicSlovakSloveneSomaliSouth AfricanSouth AmericanSouth American IndianSoviet UnionSpaniardSpanishSpanish AmericanSpanish American IndianSri LankanSubsaharan AfricanSudaneseSwedishSwissSyrianTaiwaneseThaiTlingit-HaidaTohono O'OdhamTonganTrinidadian and TobagonianTsimshianTurkishU.S. Virgin IslanderUgandanUkrainianUruguayanUteVenezuelanVietnameseWelshWest IndianYakamaYaquiYugoslavianYumanYup'ikZimbabwean
Immigration
NonimmigrantsImmigrantsAfghanistanAfricaAlbaniaArgentinaArmeniaAsiaAustraliaAustriaBahamasBangladeshBarbadosBelarusBelgiumBelizeBoliviaBosnia and HerzegovinaBrazilBulgariaBurma/MyanmarCabo VerdeCambodiaCameroonCanadaCaribbeanCentral AmericaChileChinaColombiaCongoCosta RicaCroatiaCubaCzechoslovakiaDenmarkDominicaDominican RepublicEastern AfricaEastern AsiaEastern EuropeEcuadorEgyptEl SalvadorEnglandEritreaEthiopiaEuropeFijiFranceGermanyGhanaGreeceGrenadaGuatemalaGuyanaHaitiHondurasHong KongHungaryIndiaIndonesiaIranIraqIrelandIsraelItalyJamaicaJapanJordanKazakhstanKenyaKoreaKuwaitLaosLatin AmericaLatviaLebanonLiberiaLithuaniaMalaysiaMexicoMicronesiaMiddle AfricaMoldovaMoroccoNepalNetherlandsNicaraguaNigeriaNorth AmericaNorth MacedoniaNorthern AfricaNorthern EuropeNorwayOceaniaPakistanPanamaPeruPhilippinesPolandPortugalRomaniaRussiaSaudi ArabiaScotlandSenegalSerbiaSierra LeoneSingaporeSomaliaSouth AfricaSouth AmericaSouth Central AsiaSouth Eastern AsiaSouthern EuropeSpainSri LankaSt. Vincent and the GrenadinesSudanSwedenSwitzerlandSyriaTaiwanThailandTrinidad and TobagoTurkeyUgandaUkraineUruguayUzbekistanVenezuelaVietnamWest IndiesWestern AfricaWestern AsiaWestern EuropeYemenZaireZimbabweAzores
Unemployment
Income
Poverty
Unemployment
Labor Participation
Family Structure
Vehicle Availability
Education Level
Disability

Unemployment Comparison

Lebanese

Immigrants from Central America

Excellent
Tragic
5.1%
UNEMPLOYMENT
89.2/ 100
METRIC RATING
121st/ 347
METRIC RANK
6.0%
UNEMPLOYMENT
0.0/ 100
METRIC RATING
276th/ 347
METRIC RANK

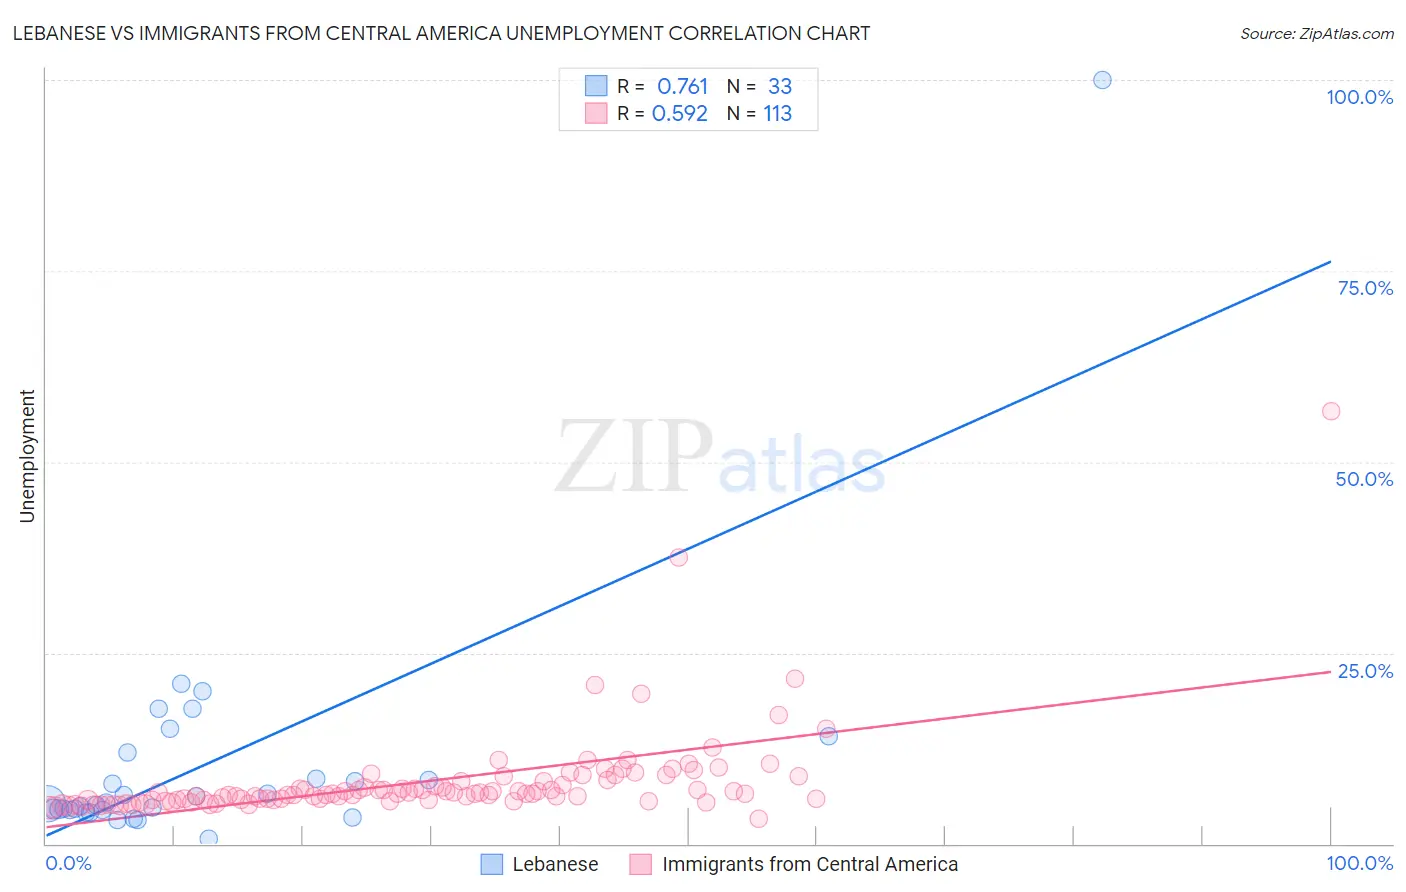
Lebanese vs Immigrants from Central America Unemployment Correlation Chart

The statistical analysis conducted on geographies consisting of 401,244,101 people shows a strong positive correlation between the proportion of Lebanese and unemployment in the United States with a correlation coefficient (R) of 0.761 and weighted average of 5.1%. Similarly, the statistical analysis conducted on geographies consisting of 534,368,587 people shows a substantial positive correlation between the proportion of Immigrants from Central America and unemployment in the United States with a correlation coefficient (R) of 0.592 and weighted average of 6.0%, a difference of 17.1%.
Lebanese vs Immigrants from Central America Unemployment

Unemployment Correlation Summary

MeasurementLebaneseImmigrants from Central America
Minimum0.70%3.3%
Maximum100.0%56.6%
Range99.3%53.3%
Mean10.4%8.1%
Median5.2%6.5%
Interquartile 25% (IQ1)4.4%5.7%
Interquartile 75% (IQ3)10.2%8.1%
Interquartile Range (IQR)5.8%2.4%
Standard Deviation (Sample)16.9%6.2%
Standard Deviation (Population)16.7%6.2%

Similar Demographics by Unemployment

Demographics Similar to Lebanese by Unemployment

In terms of unemployment, the demographic groups most similar to Lebanese are Immigrants from Switzerland (5.1%, a difference of 0.020%), Asian (5.1%, a difference of 0.040%), Macedonian (5.1%, a difference of 0.070%), Immigrants from France (5.1%, a difference of 0.080%), and Ethiopian (5.1%, a difference of 0.090%).
DemographicsRating | RankUnemployment
Immigrants | Ireland
92.1
/100
|
#114
Exceptional
5.1%
Immigrants | Western Europe
91.1
/100
|
#115
Exceptional
5.1%
Immigrants | Sri Lanka
91.1
/100
|
#116
Exceptional
5.1%
Immigrants | Malaysia
91.0
/100
|
#117
Exceptional
5.1%
Immigrants | Germany
90.8
/100
|
#118
Exceptional
5.1%
Immigrants | France
89.7
/100
|
#119
Excellent
5.1%
Macedonians
89.7
/100
|
#120
Excellent
5.1%
Lebanese
89.2
/100
|
#121
Excellent
5.1%
Immigrants | Switzerland
89.1
/100
|
#122
Excellent
5.1%
Asians
89.0
/100
|
#123
Excellent
5.1%
Ethiopians
88.6
/100
|
#124
Excellent
5.1%
Immigrants | Eastern Asia
88.3
/100
|
#125
Excellent
5.1%
Kenyans
88.2
/100
|
#126
Excellent
5.1%
Immigrants | Kenya
88.2
/100
|
#127
Excellent
5.1%
Immigrants | Eastern Africa
88.1
/100
|
#128
Excellent
5.1%

Demographics Similar to Immigrants from Central America by Unemployment

In terms of unemployment, the demographic groups most similar to Immigrants from Central America are Immigrants from Latin America (5.9%, a difference of 0.28%), Armenian (6.0%, a difference of 0.35%), Bahamian (5.9%, a difference of 0.49%), Ghanaian (6.0%, a difference of 0.64%), and Immigrants from Fiji (5.9%, a difference of 0.78%).
DemographicsRating | RankUnemployment
Immigrants | El Salvador
0.1
/100
|
#269
Tragic
5.8%
Blackfeet
0.1
/100
|
#270
Tragic
5.8%
Mexicans
0.1
/100
|
#271
Tragic
5.9%
Hispanics or Latinos
0.0
/100
|
#272
Tragic
5.9%
Immigrants | Fiji
0.0
/100
|
#273
Tragic
5.9%
Bahamians
0.0
/100
|
#274
Tragic
5.9%
Immigrants | Latin America
0.0
/100
|
#275
Tragic
5.9%
Immigrants | Central America
0.0
/100
|
#276
Tragic
6.0%
Armenians
0.0
/100
|
#277
Tragic
6.0%
Ghanaians
0.0
/100
|
#278
Tragic
6.0%
Immigrants | Mexico
0.0
/100
|
#279
Tragic
6.0%
Immigrants | Western Africa
0.0
/100
|
#280
Tragic
6.0%
Africans
0.0
/100
|
#281
Tragic
6.1%
Immigrants | Azores
0.0
/100
|
#282
Tragic
6.1%
Immigrants | Ghana
0.0
/100
|
#283
Tragic
6.1%