Lebanese vs Immigrants from the Azores Unemployment
COMPARE
Lebanese
Immigrants from the Azores
Unemployment
Unemployment Comparison
Lebanese
Immigrants from the Azores
5.1%
UNEMPLOYMENT
89.2/ 100
METRIC RATING
121st/ 347
METRIC RANK
6.1%
UNEMPLOYMENT
0.0/ 100
METRIC RATING
282nd/ 347
METRIC RANK
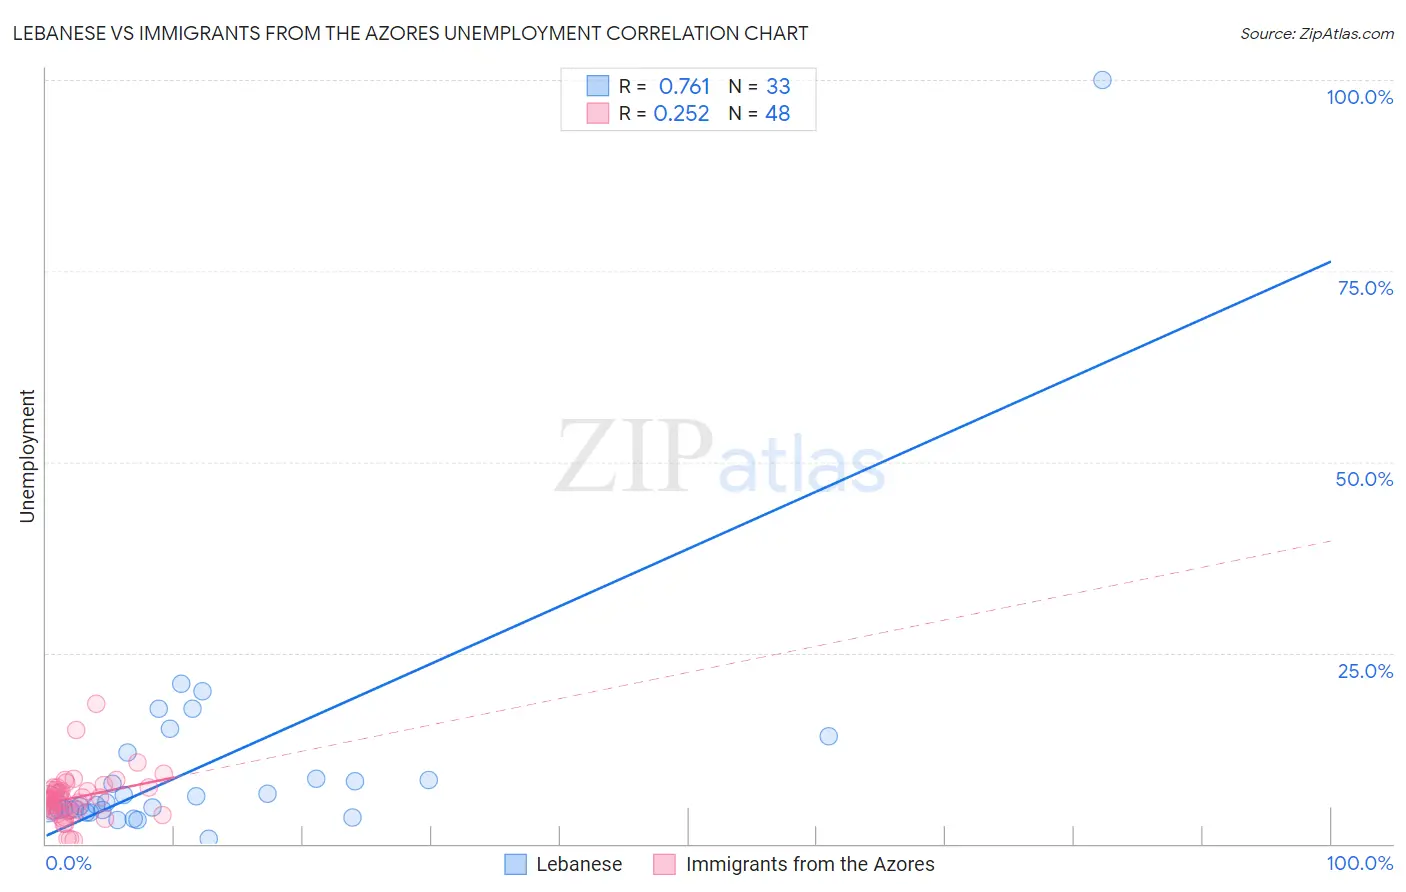
Lebanese vs Immigrants from the Azores Unemployment Correlation Chart
The statistical analysis conducted on geographies consisting of 401,244,101 people shows a strong positive correlation between the proportion of Lebanese and unemployment in the United States with a correlation coefficient (R) of 0.761 and weighted average of 5.1%. Similarly, the statistical analysis conducted on geographies consisting of 46,243,359 people shows a weak positive correlation between the proportion of Immigrants from the Azores and unemployment in the United States with a correlation coefficient (R) of 0.252 and weighted average of 6.1%, a difference of 19.1%.
Unemployment Correlation Summary
| Measurement | Lebanese | Immigrants from the Azores |
| Minimum | 0.70% | 0.50% |
| Maximum | 100.0% | 18.3% |
| Range | 99.3% | 17.8% |
| Mean | 10.4% | 6.0% |
| Median | 5.2% | 5.7% |
| Interquartile 25% (IQ1) | 4.4% | 4.3% |
| Interquartile 75% (IQ3) | 10.2% | 7.2% |
| Interquartile Range (IQR) | 5.8% | 2.9% |
| Standard Deviation (Sample) | 16.9% | 3.1% |
| Standard Deviation (Population) | 16.7% | 3.1% |
Similar Demographics by Unemployment
Demographics Similar to Lebanese by Unemployment
In terms of unemployment, the demographic groups most similar to Lebanese are Immigrants from Switzerland (5.1%, a difference of 0.020%), Asian (5.1%, a difference of 0.040%), Macedonian (5.1%, a difference of 0.070%), Immigrants from France (5.1%, a difference of 0.080%), and Ethiopian (5.1%, a difference of 0.090%).
| Demographics | Rating | Rank | Unemployment |
| Immigrants | Ireland | 92.1 /100 | #114 | Exceptional 5.1% |
| Immigrants | Western Europe | 91.1 /100 | #115 | Exceptional 5.1% |
| Immigrants | Sri Lanka | 91.1 /100 | #116 | Exceptional 5.1% |
| Immigrants | Malaysia | 91.0 /100 | #117 | Exceptional 5.1% |
| Immigrants | Germany | 90.8 /100 | #118 | Exceptional 5.1% |
| Immigrants | France | 89.7 /100 | #119 | Excellent 5.1% |
| Macedonians | 89.7 /100 | #120 | Excellent 5.1% |
| Lebanese | 89.2 /100 | #121 | Excellent 5.1% |
| Immigrants | Switzerland | 89.1 /100 | #122 | Excellent 5.1% |
| Asians | 89.0 /100 | #123 | Excellent 5.1% |
| Ethiopians | 88.6 /100 | #124 | Excellent 5.1% |
| Immigrants | Eastern Asia | 88.3 /100 | #125 | Excellent 5.1% |
| Kenyans | 88.2 /100 | #126 | Excellent 5.1% |
| Immigrants | Kenya | 88.2 /100 | #127 | Excellent 5.1% |
| Immigrants | Eastern Africa | 88.1 /100 | #128 | Excellent 5.1% |
Demographics Similar to Immigrants from the Azores by Unemployment
In terms of unemployment, the demographic groups most similar to Immigrants from the Azores are African (6.1%, a difference of 0.060%), Immigrants from Ghana (6.1%, a difference of 0.080%), Aleut (6.1%, a difference of 0.21%), Immigrants from Western Africa (6.0%, a difference of 0.64%), and Immigrants from Mexico (6.0%, a difference of 0.65%).
| Demographics | Rating | Rank | Unemployment |
| Immigrants | Latin America | 0.0 /100 | #275 | Tragic 5.9% |
| Immigrants | Central America | 0.0 /100 | #276 | Tragic 6.0% |
| Armenians | 0.0 /100 | #277 | Tragic 6.0% |
| Ghanaians | 0.0 /100 | #278 | Tragic 6.0% |
| Immigrants | Mexico | 0.0 /100 | #279 | Tragic 6.0% |
| Immigrants | Western Africa | 0.0 /100 | #280 | Tragic 6.0% |
| Africans | 0.0 /100 | #281 | Tragic 6.1% |
| Immigrants | Azores | 0.0 /100 | #282 | Tragic 6.1% |
| Immigrants | Ghana | 0.0 /100 | #283 | Tragic 6.1% |
| Aleuts | 0.0 /100 | #284 | Tragic 6.1% |
| Immigrants | Senegal | 0.0 /100 | #285 | Tragic 6.1% |
| Immigrants | Caribbean | 0.0 /100 | #286 | Tragic 6.2% |
| Nepalese | 0.0 /100 | #287 | Tragic 6.2% |
| Ecuadorians | 0.0 /100 | #288 | Tragic 6.2% |
| Chippewa | 0.0 /100 | #289 | Tragic 6.2% |