Salvadoran vs Immigrants from Jamaica Female Unemployment
COMPARE
Salvadoran
Immigrants from Jamaica
Female Unemployment
Female Unemployment Comparison
Salvadorans
Immigrants from Jamaica
6.0%
FEMALE UNEMPLOYMENT
0.0/ 100
METRIC RATING
283rd/ 347
METRIC RANK
6.2%
FEMALE UNEMPLOYMENT
0.0/ 100
METRIC RATING
304th/ 347
METRIC RANK
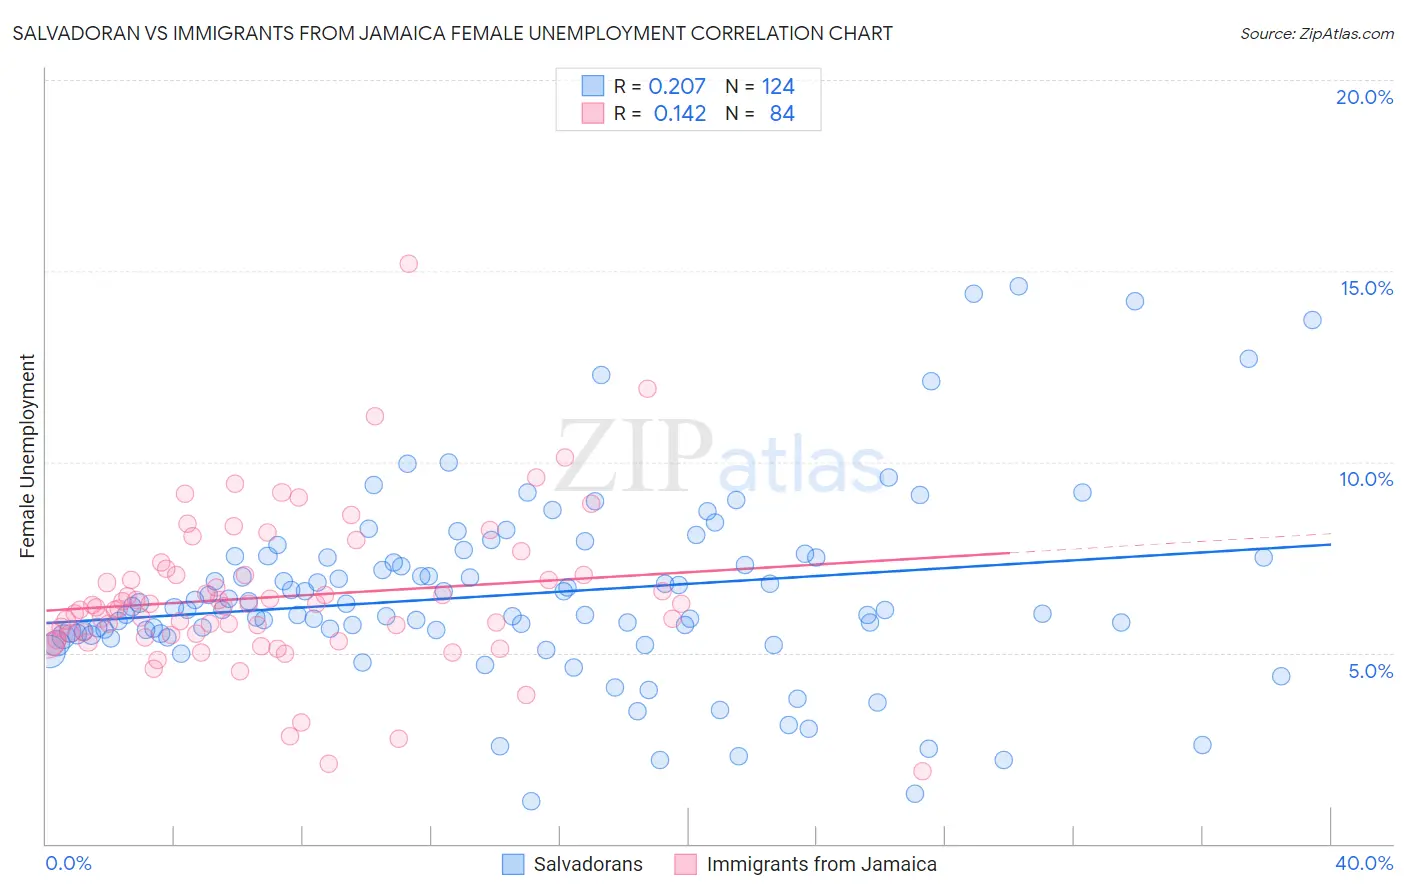
Salvadoran vs Immigrants from Jamaica Female Unemployment Correlation Chart
The statistical analysis conducted on geographies consisting of 397,211,124 people shows a weak positive correlation between the proportion of Salvadorans and unemploymnet rate among females in the United States with a correlation coefficient (R) of 0.207 and weighted average of 6.0%. Similarly, the statistical analysis conducted on geographies consisting of 300,910,476 people shows a poor positive correlation between the proportion of Immigrants from Jamaica and unemploymnet rate among females in the United States with a correlation coefficient (R) of 0.142 and weighted average of 6.2%, a difference of 2.9%.
Female Unemployment Correlation Summary
| Measurement | Salvadoran | Immigrants from Jamaica |
| Minimum | 1.1% | 1.9% |
| Maximum | 14.6% | 15.2% |
| Range | 13.5% | 13.3% |
| Mean | 6.5% | 6.5% |
| Median | 6.1% | 6.2% |
| Interquartile 25% (IQ1) | 5.5% | 5.4% |
| Interquartile 75% (IQ3) | 7.5% | 7.0% |
| Interquartile Range (IQR) | 2.0% | 1.6% |
| Standard Deviation (Sample) | 2.4% | 2.0% |
| Standard Deviation (Population) | 2.4% | 2.0% |
Similar Demographics by Female Unemployment
Demographics Similar to Salvadorans by Female Unemployment
In terms of female unemployment, the demographic groups most similar to Salvadorans are Colville (6.0%, a difference of 0.10%), Immigrants from Senegal (6.1%, a difference of 0.34%), Guatemalan (6.0%, a difference of 0.37%), Mexican American Indian (6.0%, a difference of 0.41%), and Armenian (6.0%, a difference of 0.47%).
| Demographics | Rating | Rank | Female Unemployment |
| Bahamians | 0.0 /100 | #276 | Tragic 6.0% |
| Immigrants | Ghana | 0.0 /100 | #277 | Tragic 6.0% |
| Yaqui | 0.0 /100 | #278 | Tragic 6.0% |
| Armenians | 0.0 /100 | #279 | Tragic 6.0% |
| Mexican American Indians | 0.0 /100 | #280 | Tragic 6.0% |
| Guatemalans | 0.0 /100 | #281 | Tragic 6.0% |
| Colville | 0.0 /100 | #282 | Tragic 6.0% |
| Salvadorans | 0.0 /100 | #283 | Tragic 6.0% |
| Immigrants | Senegal | 0.0 /100 | #284 | Tragic 6.1% |
| Immigrants | Cabo Verde | 0.0 /100 | #285 | Tragic 6.1% |
| Chippewa | 0.0 /100 | #286 | Tragic 6.1% |
| Immigrants | Guatemala | 0.0 /100 | #287 | Tragic 6.1% |
| Haitians | 0.0 /100 | #288 | Tragic 6.1% |
| Trinidadians and Tobagonians | 0.0 /100 | #289 | Tragic 6.1% |
| Immigrants | Caribbean | 0.0 /100 | #290 | Tragic 6.1% |
Demographics Similar to Immigrants from Jamaica by Female Unemployment
In terms of female unemployment, the demographic groups most similar to Immigrants from Jamaica are Spanish American Indian (6.2%, a difference of 0.060%), Immigrants from Central America (6.2%, a difference of 0.21%), Shoshone (6.2%, a difference of 0.23%), Hispanic or Latino (6.2%, a difference of 0.29%), and Barbadian (6.2%, a difference of 0.37%).
| Demographics | Rating | Rank | Female Unemployment |
| West Indians | 0.0 /100 | #297 | Tragic 6.1% |
| Jamaicans | 0.0 /100 | #298 | Tragic 6.1% |
| Ute | 0.0 /100 | #299 | Tragic 6.1% |
| Immigrants | Haiti | 0.0 /100 | #300 | Tragic 6.1% |
| Immigrants | Barbados | 0.0 /100 | #301 | Tragic 6.2% |
| U.S. Virgin Islanders | 0.0 /100 | #302 | Tragic 6.2% |
| Barbadians | 0.0 /100 | #303 | Tragic 6.2% |
| Immigrants | Jamaica | 0.0 /100 | #304 | Tragic 6.2% |
| Spanish American Indians | 0.0 /100 | #305 | Tragic 6.2% |
| Immigrants | Central America | 0.0 /100 | #306 | Tragic 6.2% |
| Shoshone | 0.0 /100 | #307 | Tragic 6.2% |
| Hispanics or Latinos | 0.0 /100 | #308 | Tragic 6.2% |
| Ecuadorians | 0.0 /100 | #309 | Tragic 6.3% |
| Central American Indians | 0.0 /100 | #310 | Tragic 6.3% |
| Immigrants | Mexico | 0.0 /100 | #311 | Tragic 6.3% |