Cree vs Immigrants from Jamaica Female Unemployment
COMPARE
Cree
Immigrants from Jamaica
Female Unemployment
Female Unemployment Comparison
Cree
Immigrants from Jamaica
5.6%
FEMALE UNEMPLOYMENT
1.0/ 100
METRIC RATING
248th/ 347
METRIC RANK
6.2%
FEMALE UNEMPLOYMENT
0.0/ 100
METRIC RATING
304th/ 347
METRIC RANK
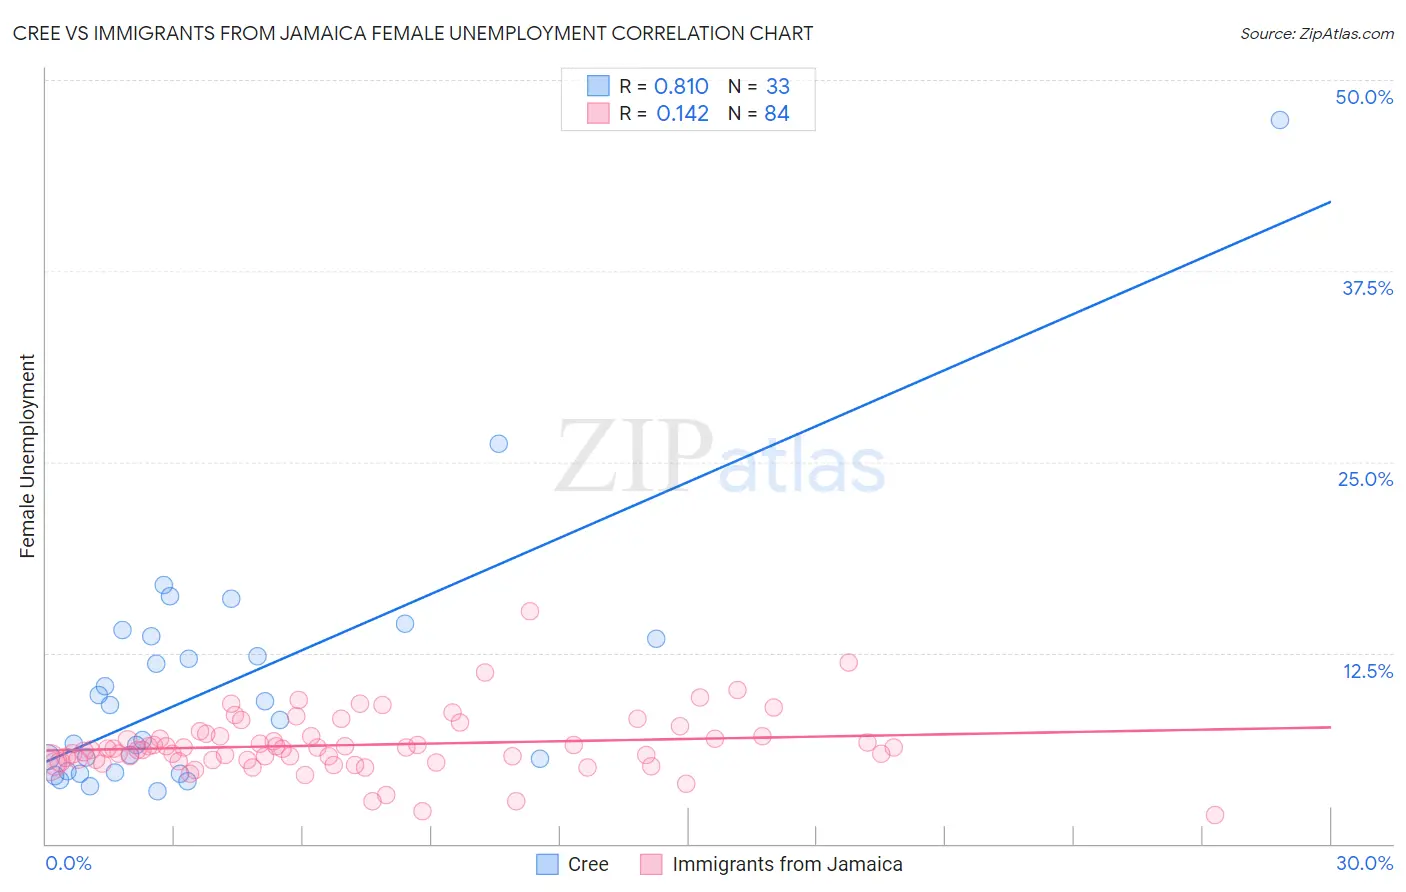
Cree vs Immigrants from Jamaica Female Unemployment Correlation Chart
The statistical analysis conducted on geographies consisting of 76,053,409 people shows a very strong positive correlation between the proportion of Cree and unemploymnet rate among females in the United States with a correlation coefficient (R) of 0.810 and weighted average of 5.6%. Similarly, the statistical analysis conducted on geographies consisting of 300,910,476 people shows a poor positive correlation between the proportion of Immigrants from Jamaica and unemploymnet rate among females in the United States with a correlation coefficient (R) of 0.142 and weighted average of 6.2%, a difference of 10.5%.
Female Unemployment Correlation Summary
| Measurement | Cree | Immigrants from Jamaica |
| Minimum | 3.4% | 1.9% |
| Maximum | 47.4% | 15.2% |
| Range | 44.0% | 13.3% |
| Mean | 10.4% | 6.5% |
| Median | 8.1% | 6.2% |
| Interquartile 25% (IQ1) | 4.7% | 5.4% |
| Interquartile 75% (IQ3) | 13.5% | 7.0% |
| Interquartile Range (IQR) | 8.8% | 1.6% |
| Standard Deviation (Sample) | 8.4% | 2.0% |
| Standard Deviation (Population) | 8.3% | 2.0% |
Similar Demographics by Female Unemployment
Demographics Similar to Cree by Female Unemployment
In terms of female unemployment, the demographic groups most similar to Cree are Immigrants from Uzbekistan (5.6%, a difference of 0.040%), Immigrants from Western Asia (5.6%, a difference of 0.16%), Japanese (5.6%, a difference of 0.24%), Immigrants from Syria (5.6%, a difference of 0.33%), and Assyrian/Chaldean/Syriac (5.6%, a difference of 0.39%).
| Demographics | Rating | Rank | Female Unemployment |
| South American Indians | 2.8 /100 | #241 | Tragic 5.5% |
| Marshallese | 2.3 /100 | #242 | Tragic 5.6% |
| Spanish Americans | 2.2 /100 | #243 | Tragic 5.6% |
| Immigrants | Liberia | 1.5 /100 | #244 | Tragic 5.6% |
| Guamanians/Chamorros | 1.4 /100 | #245 | Tragic 5.6% |
| Japanese | 1.2 /100 | #246 | Tragic 5.6% |
| Immigrants | Western Asia | 1.1 /100 | #247 | Tragic 5.6% |
| Cree | 1.0 /100 | #248 | Tragic 5.6% |
| Immigrants | Uzbekistan | 1.0 /100 | #249 | Tragic 5.6% |
| Immigrants | Syria | 0.8 /100 | #250 | Tragic 5.6% |
| Assyrians/Chaldeans/Syriacs | 0.8 /100 | #251 | Tragic 5.6% |
| Cajuns | 0.7 /100 | #252 | Tragic 5.7% |
| Immigrants | Sierra Leone | 0.6 /100 | #253 | Tragic 5.7% |
| Immigrants | Immigrants | 0.6 /100 | #254 | Tragic 5.7% |
| Immigrants | Cameroon | 0.6 /100 | #255 | Tragic 5.7% |
Demographics Similar to Immigrants from Jamaica by Female Unemployment
In terms of female unemployment, the demographic groups most similar to Immigrants from Jamaica are Spanish American Indian (6.2%, a difference of 0.060%), Immigrants from Central America (6.2%, a difference of 0.21%), Shoshone (6.2%, a difference of 0.23%), Hispanic or Latino (6.2%, a difference of 0.29%), and Barbadian (6.2%, a difference of 0.37%).
| Demographics | Rating | Rank | Female Unemployment |
| West Indians | 0.0 /100 | #297 | Tragic 6.1% |
| Jamaicans | 0.0 /100 | #298 | Tragic 6.1% |
| Ute | 0.0 /100 | #299 | Tragic 6.1% |
| Immigrants | Haiti | 0.0 /100 | #300 | Tragic 6.1% |
| Immigrants | Barbados | 0.0 /100 | #301 | Tragic 6.2% |
| U.S. Virgin Islanders | 0.0 /100 | #302 | Tragic 6.2% |
| Barbadians | 0.0 /100 | #303 | Tragic 6.2% |
| Immigrants | Jamaica | 0.0 /100 | #304 | Tragic 6.2% |
| Spanish American Indians | 0.0 /100 | #305 | Tragic 6.2% |
| Immigrants | Central America | 0.0 /100 | #306 | Tragic 6.2% |
| Shoshone | 0.0 /100 | #307 | Tragic 6.2% |
| Hispanics or Latinos | 0.0 /100 | #308 | Tragic 6.2% |
| Ecuadorians | 0.0 /100 | #309 | Tragic 6.3% |
| Central American Indians | 0.0 /100 | #310 | Tragic 6.3% |
| Immigrants | Mexico | 0.0 /100 | #311 | Tragic 6.3% |