Kiowa vs Immigrants from Mexico Single Father Households
COMPARE
Kiowa
Immigrants from Mexico
Single Father Households
Single Father Households Comparison
Kiowa
Immigrants from Mexico
2.8%
SINGLE FATHER HOUSEHOLDS
0.0/ 100
METRIC RATING
300th/ 347
METRIC RANK
3.0%
SINGLE FATHER HOUSEHOLDS
0.0/ 100
METRIC RATING
325th/ 347
METRIC RANK
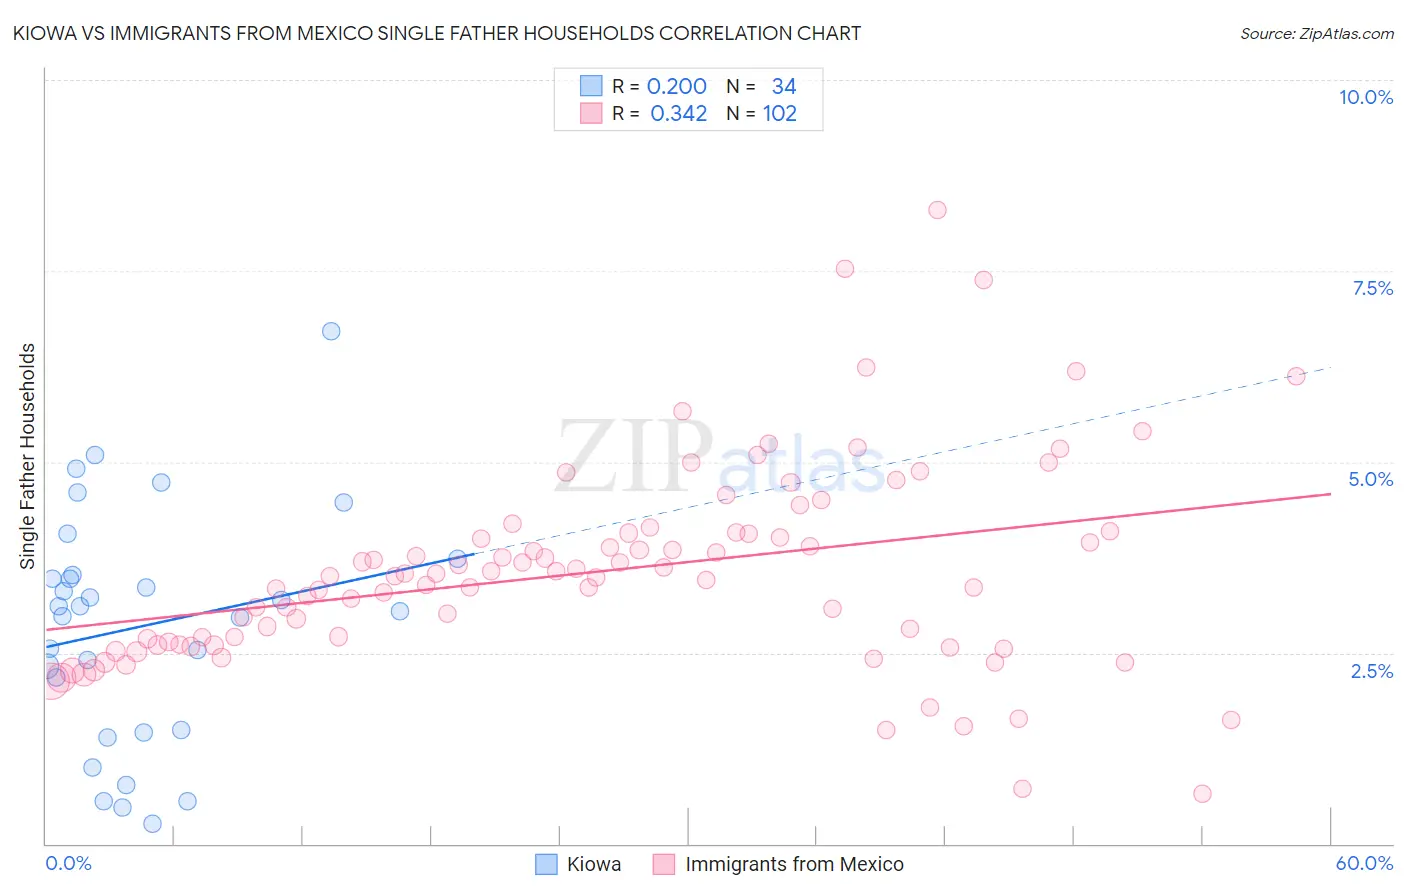
Kiowa vs Immigrants from Mexico Single Father Households Correlation Chart
The statistical analysis conducted on geographies consisting of 56,039,243 people shows a weak positive correlation between the proportion of Kiowa and percentage of single father households in the United States with a correlation coefficient (R) of 0.200 and weighted average of 2.8%. Similarly, the statistical analysis conducted on geographies consisting of 505,512,983 people shows a mild positive correlation between the proportion of Immigrants from Mexico and percentage of single father households in the United States with a correlation coefficient (R) of 0.342 and weighted average of 3.0%, a difference of 8.9%.
Single Father Households Correlation Summary
| Measurement | Kiowa | Immigrants from Mexico |
| Minimum | 0.27% | 0.65% |
| Maximum | 6.7% | 8.3% |
| Range | 6.4% | 7.6% |
| Mean | 2.9% | 3.6% |
| Median | 3.1% | 3.5% |
| Interquartile 25% (IQ1) | 1.5% | 2.6% |
| Interquartile 75% (IQ3) | 3.5% | 4.1% |
| Interquartile Range (IQR) | 2.0% | 1.5% |
| Standard Deviation (Sample) | 1.5% | 1.3% |
| Standard Deviation (Population) | 1.5% | 1.3% |
Similar Demographics by Single Father Households
Demographics Similar to Kiowa by Single Father Households
In terms of single father households, the demographic groups most similar to Kiowa are Immigrants from Latin America (2.8%, a difference of 0.050%), Lumbee (2.8%, a difference of 0.40%), Spanish American (2.8%, a difference of 0.58%), Immigrants from Honduras (2.8%, a difference of 0.60%), and Cree (2.8%, a difference of 0.77%).
| Demographics | Rating | Rank | Single Father Households |
| Immigrants | Fiji | 0.0 /100 | #293 | Tragic 2.7% |
| Malaysians | 0.0 /100 | #294 | Tragic 2.7% |
| Chickasaw | 0.0 /100 | #295 | Tragic 2.8% |
| Japanese | 0.0 /100 | #296 | Tragic 2.8% |
| Hondurans | 0.0 /100 | #297 | Tragic 2.8% |
| Cree | 0.0 /100 | #298 | Tragic 2.8% |
| Lumbee | 0.0 /100 | #299 | Tragic 2.8% |
| Kiowa | 0.0 /100 | #300 | Tragic 2.8% |
| Immigrants | Latin America | 0.0 /100 | #301 | Tragic 2.8% |
| Spanish Americans | 0.0 /100 | #302 | Tragic 2.8% |
| Immigrants | Honduras | 0.0 /100 | #303 | Tragic 2.8% |
| Mexican American Indians | 0.0 /100 | #304 | Tragic 2.8% |
| Hispanics or Latinos | 0.0 /100 | #305 | Tragic 2.8% |
| Immigrants | Azores | 0.0 /100 | #306 | Tragic 2.8% |
| Hopi | 0.0 /100 | #307 | Tragic 2.8% |
Demographics Similar to Immigrants from Mexico by Single Father Households
In terms of single father households, the demographic groups most similar to Immigrants from Mexico are Aleut (3.0%, a difference of 0.19%), Bangladeshi (3.1%, a difference of 1.1%), Fijian (3.0%, a difference of 1.2%), Immigrants from Central America (3.0%, a difference of 1.3%), and Immigrants from Guatemala (3.0%, a difference of 1.6%).
| Demographics | Rating | Rank | Single Father Households |
| Cape Verdeans | 0.0 /100 | #318 | Tragic 2.9% |
| Ute | 0.0 /100 | #319 | Tragic 3.0% |
| Guatemalans | 0.0 /100 | #320 | Tragic 3.0% |
| Mexicans | 0.0 /100 | #321 | Tragic 3.0% |
| Immigrants | Guatemala | 0.0 /100 | #322 | Tragic 3.0% |
| Immigrants | Central America | 0.0 /100 | #323 | Tragic 3.0% |
| Fijians | 0.0 /100 | #324 | Tragic 3.0% |
| Immigrants | Mexico | 0.0 /100 | #325 | Tragic 3.0% |
| Aleuts | 0.0 /100 | #326 | Tragic 3.0% |
| Bangladeshis | 0.0 /100 | #327 | Tragic 3.1% |
| Immigrants | Cabo Verde | 0.0 /100 | #328 | Tragic 3.1% |
| Chippewa | 0.0 /100 | #329 | Tragic 3.1% |
| Nepalese | 0.0 /100 | #330 | Tragic 3.1% |
| Navajo | 0.0 /100 | #331 | Tragic 3.2% |
| Yaqui | 0.0 /100 | #332 | Tragic 3.2% |