Kiowa vs Immigrants from Cambodia Female Unemployment

COMPARE

Kiowa
Race
Ancestry
AfghanAfricanAlaska NativeAlaskan AthabascanAlbanianAleutAlsatianAmericanApacheArabArapahoArgentineanArmenianAssyrian/Chaldean/SyriacAustralianAustrianBahamianBangladeshiBarbadianBasqueBelgianBelizeanBermudanBhutaneseBlackfeetBolivianBrazilianBritishBritish West IndianBulgarianBurmeseCajunCambodianCanadianCape VerdeanCarpatho RusynCelticCentral AmericanCentral American IndianCherokeeCheyenneChickasawChileanChineseChippewaChoctawColombianColvilleComancheCosta RicanCreeCreekCroatianCrowCubanCypriotCzechCzechoslovakianDanishDelawareDominicanDutchDutch West IndianEastern EuropeanEcuadorianEgyptianEnglishEstonianEthiopianEuropeanFijianFilipinoFinnishFrenchFrench American IndianFrench CanadianGermanGerman RussianGhanaianGreekGuamanian/ChamorroGuatemalanGuyaneseHaitianHmongHonduranHopiHoumaHungarianIcelanderIndian (Asian)IndonesianInupiatIranianIraqiIrishIroquoisIsraeliItalianJamaicanJapaneseJordanianKenyanKiowaKoreanLaotianLatvianLebaneseLiberianLithuanianLumbeeLuxembourgerMacedonianMalaysianMalteseMarshalleseMenomineeMexicanMexican American IndianMongolianMoroccanNative HawaiianNavajoNepaleseNew ZealanderNicaraguanNigerianNorthern EuropeanNorwegianOkinawanOsageOttawaPaiutePakistaniPalestinianPanamanianParaguayanPennsylvania GermanPeruvianPimaPolishPortuguesePotawatomiPuebloPuerto RicanPuget Sound SalishRomanianRussianSalvadoranSamoanScandinavianScotch-IrishScottishSeminoleSenegaleseSerbianShoshoneSierra LeoneanSiouxSlavicSlovakSloveneSomaliSouth AfricanSouth AmericanSouth American IndianSoviet UnionSpaniardSpanishSpanish AmericanSpanish American IndianSri LankanSubsaharan AfricanSudaneseSwedishSwissSyrianTaiwaneseThaiTlingit-HaidaTohono O'OdhamTonganTrinidadian and TobagonianTsimshianTurkishU.S. Virgin IslanderUgandanUkrainianUruguayanUteVenezuelanVietnameseWelshWest IndianYakamaYaquiYugoslavianYumanYup'ikZimbabwean
Immigration
NonimmigrantsImmigrantsAfghanistanAfricaAlbaniaArgentinaArmeniaAsiaAustraliaAustriaBahamasBangladeshBarbadosBelarusBelgiumBelizeBoliviaBosnia and HerzegovinaBrazilBulgariaBurma/MyanmarCabo VerdeCameroonCanadaCaribbeanCentral AmericaChileChinaColombiaCongoCosta RicaCroatiaCubaCzechoslovakiaDenmarkDominicaDominican RepublicEastern AfricaEastern AsiaEastern EuropeEcuadorEgyptEl SalvadorEnglandEritreaEthiopiaEuropeFijiFranceGermanyGhanaGreeceGrenadaGuatemalaGuyanaHaitiHondurasHong KongHungaryIndiaIndonesiaIranIraqIrelandIsraelItalyJamaicaJapanJordanKazakhstanKenyaKoreaKuwaitLaosLatin AmericaLatviaLebanonLiberiaLithuaniaMalaysiaMexicoMicronesiaMiddle AfricaMoldovaMoroccoNepalNetherlandsNicaraguaNigeriaNorth AmericaNorth MacedoniaNorthern AfricaNorthern EuropeNorwayOceaniaPakistanPanamaPeruPhilippinesPolandPortugalRomaniaRussiaSaudi ArabiaScotlandSenegalSerbiaSierra LeoneSingaporeSomaliaSouth AfricaSouth AmericaSouth Central AsiaSouth Eastern AsiaSouthern EuropeSpainSri LankaSt. Vincent and the GrenadinesSudanSwedenSwitzerlandSyriaTaiwanThailandTrinidad and TobagoTurkeyUgandaUkraineUruguayUzbekistanVenezuelaVietnamWest IndiesWestern AfricaWestern AsiaWestern EuropeYemenZaireZimbabweAzores
Immigrants from Cambodia
Race
Ancestry
AfghanAfricanAlaska NativeAlaskan AthabascanAlbanianAleutAlsatianAmericanApacheArabArapahoArgentineanArmenianAssyrian/Chaldean/SyriacAustralianAustrianBahamianBangladeshiBarbadianBasqueBelgianBelizeanBermudanBhutaneseBlackfeetBolivianBrazilianBritishBritish West IndianBulgarianBurmeseCajunCambodianCanadianCape VerdeanCarpatho RusynCelticCentral AmericanCentral American IndianCherokeeCheyenneChickasawChileanChineseChippewaChoctawColombianColvilleComancheCosta RicanCreeCreekCroatianCrowCubanCypriotCzechCzechoslovakianDanishDelawareDominicanDutchDutch West IndianEastern EuropeanEcuadorianEgyptianEnglishEstonianEthiopianEuropeanFijianFilipinoFinnishFrenchFrench American IndianFrench CanadianGermanGerman RussianGhanaianGreekGuamanian/ChamorroGuatemalanGuyaneseHaitianHmongHonduranHopiHoumaHungarianIcelanderIndian (Asian)IndonesianInupiatIranianIraqiIrishIroquoisIsraeliItalianJamaicanJapaneseJordanianKenyanKoreanLaotianLatvianLebaneseLiberianLithuanianLumbeeLuxembourgerMacedonianMalaysianMalteseMarshalleseMenomineeMexicanMexican American IndianMongolianMoroccanNative HawaiianNavajoNepaleseNew ZealanderNicaraguanNigerianNorthern EuropeanNorwegianOkinawanOsageOttawaPaiutePakistaniPalestinianPanamanianParaguayanPennsylvania GermanPeruvianPimaPolishPortuguesePotawatomiPuebloPuerto RicanPuget Sound SalishRomanianRussianSalvadoranSamoanScandinavianScotch-IrishScottishSeminoleSenegaleseSerbianShoshoneSierra LeoneanSiouxSlavicSlovakSloveneSomaliSouth AfricanSouth AmericanSouth American IndianSoviet UnionSpaniardSpanishSpanish AmericanSpanish American IndianSri LankanSubsaharan AfricanSudaneseSwedishSwissSyrianTaiwaneseThaiTlingit-HaidaTohono O'OdhamTonganTrinidadian and TobagonianTsimshianTurkishU.S. Virgin IslanderUgandanUkrainianUruguayanUteVenezuelanVietnameseWelshWest IndianYakamaYaquiYugoslavianYumanYup'ikZimbabwean
Immigration
NonimmigrantsImmigrantsAfghanistanAfricaAlbaniaArgentinaArmeniaAsiaAustraliaAustriaBahamasBangladeshBarbadosBelarusBelgiumBelizeBoliviaBosnia and HerzegovinaBrazilBulgariaBurma/MyanmarCabo VerdeCambodiaCameroonCanadaCaribbeanCentral AmericaChileChinaColombiaCongoCosta RicaCroatiaCubaCzechoslovakiaDenmarkDominicaDominican RepublicEastern AfricaEastern AsiaEastern EuropeEcuadorEgyptEl SalvadorEnglandEritreaEthiopiaEuropeFijiFranceGermanyGhanaGreeceGrenadaGuatemalaGuyanaHaitiHondurasHong KongHungaryIndiaIndonesiaIranIraqIrelandIsraelItalyJamaicaJapanJordanKazakhstanKenyaKoreaKuwaitLaosLatin AmericaLatviaLebanonLiberiaLithuaniaMalaysiaMexicoMicronesiaMiddle AfricaMoldovaMoroccoNepalNetherlandsNicaraguaNigeriaNorth AmericaNorth MacedoniaNorthern AfricaNorthern EuropeNorwayOceaniaPakistanPanamaPeruPhilippinesPolandPortugalRomaniaRussiaSaudi ArabiaScotlandSenegalSerbiaSierra LeoneSingaporeSomaliaSouth AfricaSouth AmericaSouth Central AsiaSouth Eastern AsiaSouthern EuropeSpainSri LankaSt. Vincent and the GrenadinesSudanSwedenSwitzerlandSyriaTaiwanThailandTrinidad and TobagoTurkeyUgandaUkraineUruguayUzbekistanVenezuelaVietnamWest IndiesWestern AfricaWestern AsiaWestern EuropeYemenZaireZimbabweAzores
Female Unemployment
Income
Poverty
Unemployment
Labor Participation
Family Structure
Vehicle Availability
Education Level
Disability

Female Unemployment Comparison

Kiowa

Immigrants from Cambodia

Tragic
Tragic
5.8%
FEMALE UNEMPLOYMENT
0.1/ 100
METRIC RATING
261st/ 347
METRIC RANK
5.5%
FEMALE UNEMPLOYMENT
3.3/ 100
METRIC RATING
236th/ 347
METRIC RANK

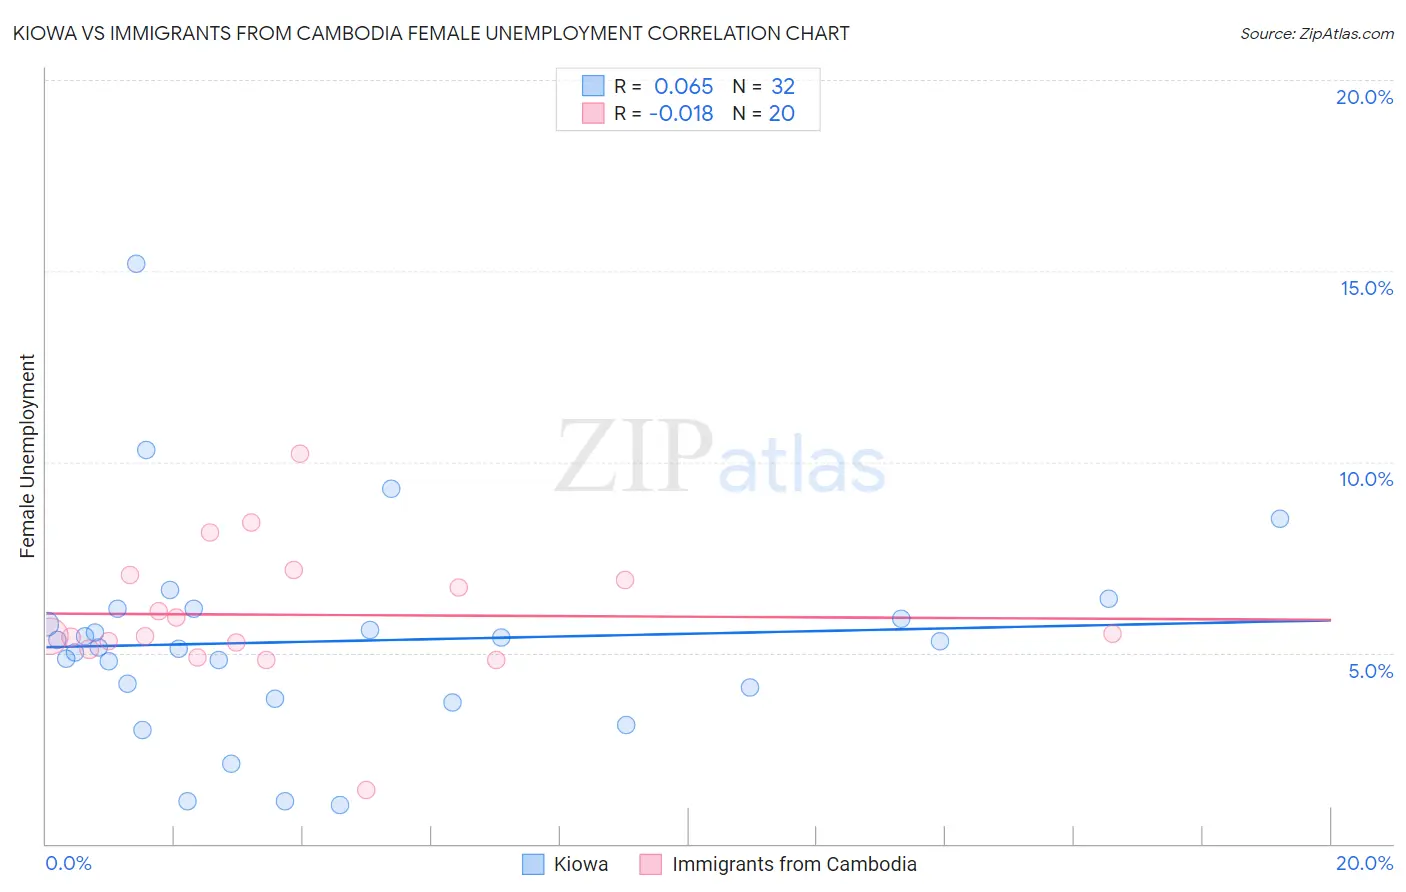
Kiowa vs Immigrants from Cambodia Female Unemployment Correlation Chart

The statistical analysis conducted on geographies consisting of 55,997,054 people shows a slight positive correlation between the proportion of Kiowa and unemploymnet rate among females in the United States with a correlation coefficient (R) of 0.065 and weighted average of 5.8%. Similarly, the statistical analysis conducted on geographies consisting of 204,858,353 people shows no correlation between the proportion of Immigrants from Cambodia and unemploymnet rate among females in the United States with a correlation coefficient (R) of -0.018 and weighted average of 5.5%, a difference of 4.5%.
Kiowa vs Immigrants from Cambodia Female Unemployment

Female Unemployment Correlation Summary

MeasurementKiowaImmigrants from Cambodia
Minimum1.0%1.4%
Maximum15.2%10.2%
Range14.2%8.8%
Mean5.3%6.0%
Median5.2%5.5%
Interquartile 25% (IQ1)4.0%5.2%
Interquartile 75% (IQ3)6.0%7.0%
Interquartile Range (IQR)2.1%1.8%
Standard Deviation (Sample)2.8%1.8%
Standard Deviation (Population)2.7%1.7%

Similar Demographics by Female Unemployment

Demographics Similar to Kiowa by Female Unemployment

In terms of female unemployment, the demographic groups most similar to Kiowa are Immigrants from Nigeria (5.8%, a difference of 0.030%), Nigerian (5.8%, a difference of 0.26%), Immigrants from Fiji (5.8%, a difference of 0.30%), Immigrants from Portugal (5.8%, a difference of 0.41%), and Immigrants from the Azores (5.8%, a difference of 0.71%).
DemographicsRating | RankFemale Unemployment
Immigrants | Immigrants
0.6
/100
|
#254
Tragic
5.7%
Immigrants | Cameroon
0.6
/100
|
#255
Tragic
5.7%
Sub-Saharan Africans
0.4
/100
|
#256
Tragic
5.7%
Dutch West Indians
0.3
/100
|
#257
Tragic
5.7%
Immigrants | Portugal
0.2
/100
|
#258
Tragic
5.8%
Immigrants | Fiji
0.2
/100
|
#259
Tragic
5.8%
Nigerians
0.2
/100
|
#260
Tragic
5.8%
Kiowa
0.1
/100
|
#261
Tragic
5.8%
Immigrants | Nigeria
0.1
/100
|
#262
Tragic
5.8%
Immigrants | Azores
0.1
/100
|
#263
Tragic
5.8%
Immigrants | Bahamas
0.1
/100
|
#264
Tragic
5.8%
Blackfeet
0.0
/100
|
#265
Tragic
5.9%
Cape Verdeans
0.0
/100
|
#266
Tragic
5.9%
Nepalese
0.0
/100
|
#267
Tragic
5.9%
Hondurans
0.0
/100
|
#268
Tragic
5.9%

Demographics Similar to Immigrants from Cambodia by Female Unemployment

In terms of female unemployment, the demographic groups most similar to Immigrants from Cambodia are Immigrants from Panama (5.5%, a difference of 0.020%), Immigrants from Iran (5.5%, a difference of 0.030%), Immigrants from Lebanon (5.5%, a difference of 0.040%), Sierra Leonean (5.5%, a difference of 0.040%), and Moroccan (5.5%, a difference of 0.060%).
DemographicsRating | RankFemale Unemployment
Panamanians
4.7
/100
|
#229
Tragic
5.5%
Immigrants | Uruguay
4.7
/100
|
#230
Tragic
5.5%
Immigrants | Iraq
3.9
/100
|
#231
Tragic
5.5%
Liberians
3.9
/100
|
#232
Tragic
5.5%
Moroccans
3.4
/100
|
#233
Tragic
5.5%
Immigrants | Lebanon
3.3
/100
|
#234
Tragic
5.5%
Immigrants | Iran
3.3
/100
|
#235
Tragic
5.5%
Immigrants | Cambodia
3.3
/100
|
#236
Tragic
5.5%
Immigrants | Panama
3.2
/100
|
#237
Tragic
5.5%
Sierra Leoneans
3.2
/100
|
#238
Tragic
5.5%
Aleuts
3.0
/100
|
#239
Tragic
5.5%
Immigrants | South America
2.9
/100
|
#240
Tragic
5.5%
South American Indians
2.8
/100
|
#241
Tragic
5.5%
Marshallese
2.3
/100
|
#242
Tragic
5.6%
Spanish Americans
2.2
/100
|
#243
Tragic
5.6%