Kiowa vs Slovak Female Unemployment
COMPARE
Kiowa
Slovak
Female Unemployment
Female Unemployment Comparison
Kiowa
Slovaks
5.8%
FEMALE UNEMPLOYMENT
0.1/ 100
METRIC RATING
261st/ 347
METRIC RANK
4.8%
FEMALE UNEMPLOYMENT
99.8/ 100
METRIC RATING
32nd/ 347
METRIC RANK
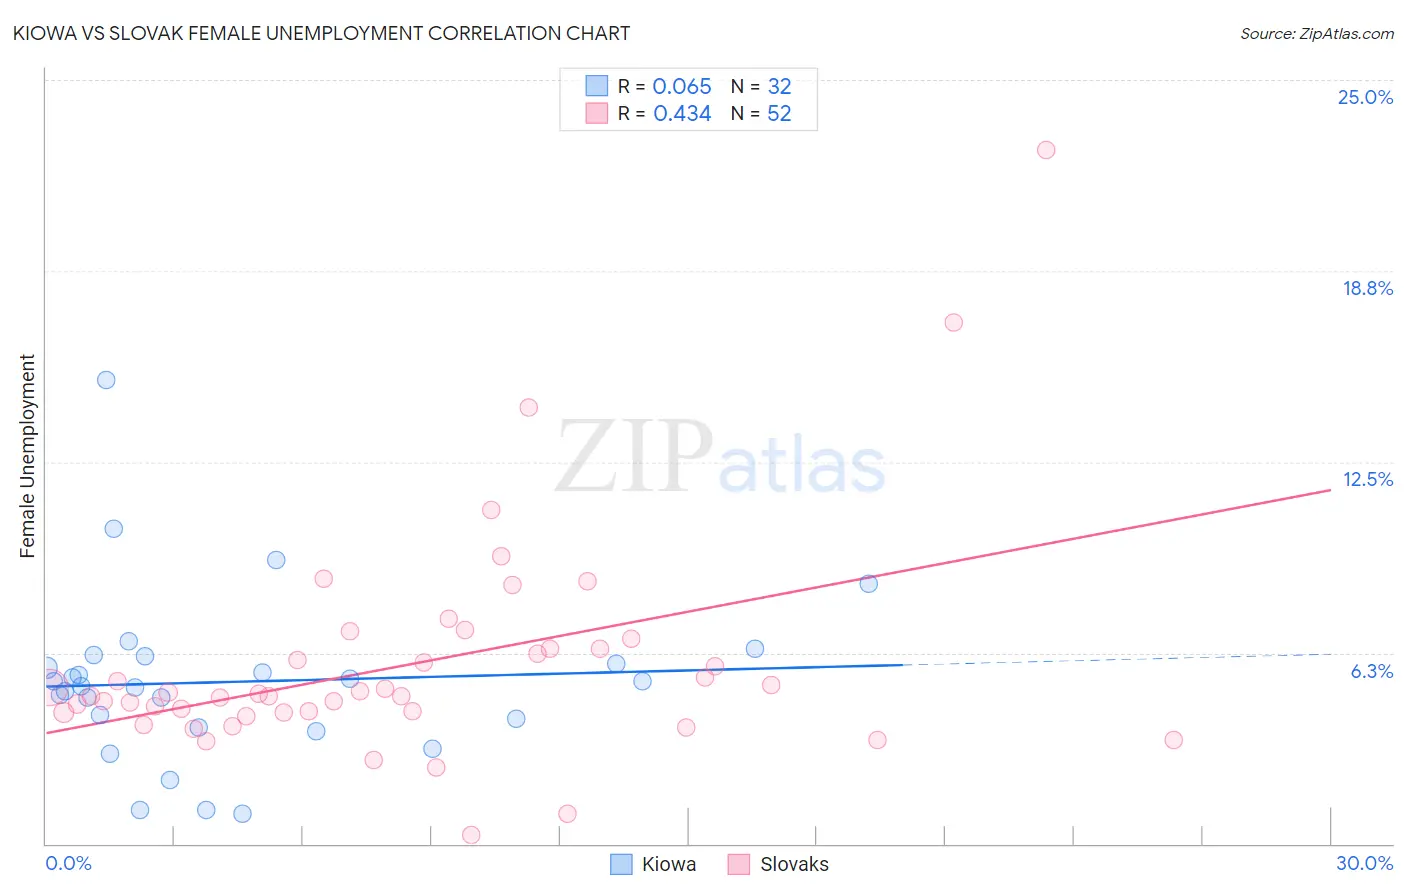
Kiowa vs Slovak Female Unemployment Correlation Chart
The statistical analysis conducted on geographies consisting of 55,997,054 people shows a slight positive correlation between the proportion of Kiowa and unemploymnet rate among females in the United States with a correlation coefficient (R) of 0.065 and weighted average of 5.8%. Similarly, the statistical analysis conducted on geographies consisting of 394,798,078 people shows a moderate positive correlation between the proportion of Slovaks and unemploymnet rate among females in the United States with a correlation coefficient (R) of 0.434 and weighted average of 4.8%, a difference of 21.2%.
Female Unemployment Correlation Summary
| Measurement | Kiowa | Slovak |
| Minimum | 1.0% | 0.30% |
| Maximum | 15.2% | 22.7% |
| Range | 14.2% | 22.4% |
| Mean | 5.3% | 5.9% |
| Median | 5.2% | 4.9% |
| Interquartile 25% (IQ1) | 4.0% | 4.3% |
| Interquartile 75% (IQ3) | 6.0% | 6.4% |
| Interquartile Range (IQR) | 2.1% | 2.1% |
| Standard Deviation (Sample) | 2.8% | 3.7% |
| Standard Deviation (Population) | 2.7% | 3.6% |
Similar Demographics by Female Unemployment
Demographics Similar to Kiowa by Female Unemployment
In terms of female unemployment, the demographic groups most similar to Kiowa are Immigrants from Nigeria (5.8%, a difference of 0.030%), Nigerian (5.8%, a difference of 0.26%), Immigrants from Fiji (5.8%, a difference of 0.30%), Immigrants from Portugal (5.8%, a difference of 0.41%), and Immigrants from the Azores (5.8%, a difference of 0.71%).
| Demographics | Rating | Rank | Female Unemployment |
| Immigrants | Immigrants | 0.6 /100 | #254 | Tragic 5.7% |
| Immigrants | Cameroon | 0.6 /100 | #255 | Tragic 5.7% |
| Sub-Saharan Africans | 0.4 /100 | #256 | Tragic 5.7% |
| Dutch West Indians | 0.3 /100 | #257 | Tragic 5.7% |
| Immigrants | Portugal | 0.2 /100 | #258 | Tragic 5.8% |
| Immigrants | Fiji | 0.2 /100 | #259 | Tragic 5.8% |
| Nigerians | 0.2 /100 | #260 | Tragic 5.8% |
| Kiowa | 0.1 /100 | #261 | Tragic 5.8% |
| Immigrants | Nigeria | 0.1 /100 | #262 | Tragic 5.8% |
| Immigrants | Azores | 0.1 /100 | #263 | Tragic 5.8% |
| Immigrants | Bahamas | 0.1 /100 | #264 | Tragic 5.8% |
| Blackfeet | 0.0 /100 | #265 | Tragic 5.9% |
| Cape Verdeans | 0.0 /100 | #266 | Tragic 5.9% |
| Nepalese | 0.0 /100 | #267 | Tragic 5.9% |
| Hondurans | 0.0 /100 | #268 | Tragic 5.9% |
Demographics Similar to Slovaks by Female Unemployment
In terms of female unemployment, the demographic groups most similar to Slovaks are Sudanese (4.8%, a difference of 0.14%), Lithuanian (4.7%, a difference of 0.42%), Czechoslovakian (4.8%, a difference of 0.51%), Cypriot (4.7%, a difference of 0.54%), and Zimbabwean (4.8%, a difference of 0.54%).
| Demographics | Rating | Rank | Female Unemployment |
| Immigrants | India | 99.9 /100 | #25 | Exceptional 4.7% |
| Immigrants | Bosnia and Herzegovina | 99.9 /100 | #26 | Exceptional 4.7% |
| British | 99.9 /100 | #27 | Exceptional 4.7% |
| Irish | 99.9 /100 | #28 | Exceptional 4.7% |
| Cypriots | 99.9 /100 | #29 | Exceptional 4.7% |
| Lithuanians | 99.8 /100 | #30 | Exceptional 4.7% |
| Sudanese | 99.8 /100 | #31 | Exceptional 4.8% |
| Slovaks | 99.8 /100 | #32 | Exceptional 4.8% |
| Czechoslovakians | 99.7 /100 | #33 | Exceptional 4.8% |
| Zimbabweans | 99.7 /100 | #34 | Exceptional 4.8% |
| French Canadians | 99.7 /100 | #35 | Exceptional 4.8% |
| Yugoslavians | 99.7 /100 | #36 | Exceptional 4.8% |
| Pennsylvania Germans | 99.6 /100 | #37 | Exceptional 4.8% |
| Northern Europeans | 99.6 /100 | #38 | Exceptional 4.8% |
| Scotch-Irish | 99.6 /100 | #39 | Exceptional 4.8% |