Alsatian vs Trinidadian and Tobagonian Unemployment
COMPARE
Alsatian
Trinidadian and Tobagonian
Unemployment
Unemployment Comparison
Alsatians
Trinidadians and Tobagonians
5.3%
UNEMPLOYMENT
37.0/ 100
METRIC RATING
188th/ 347
METRIC RANK
6.3%
UNEMPLOYMENT
0.0/ 100
METRIC RATING
301st/ 347
METRIC RANK
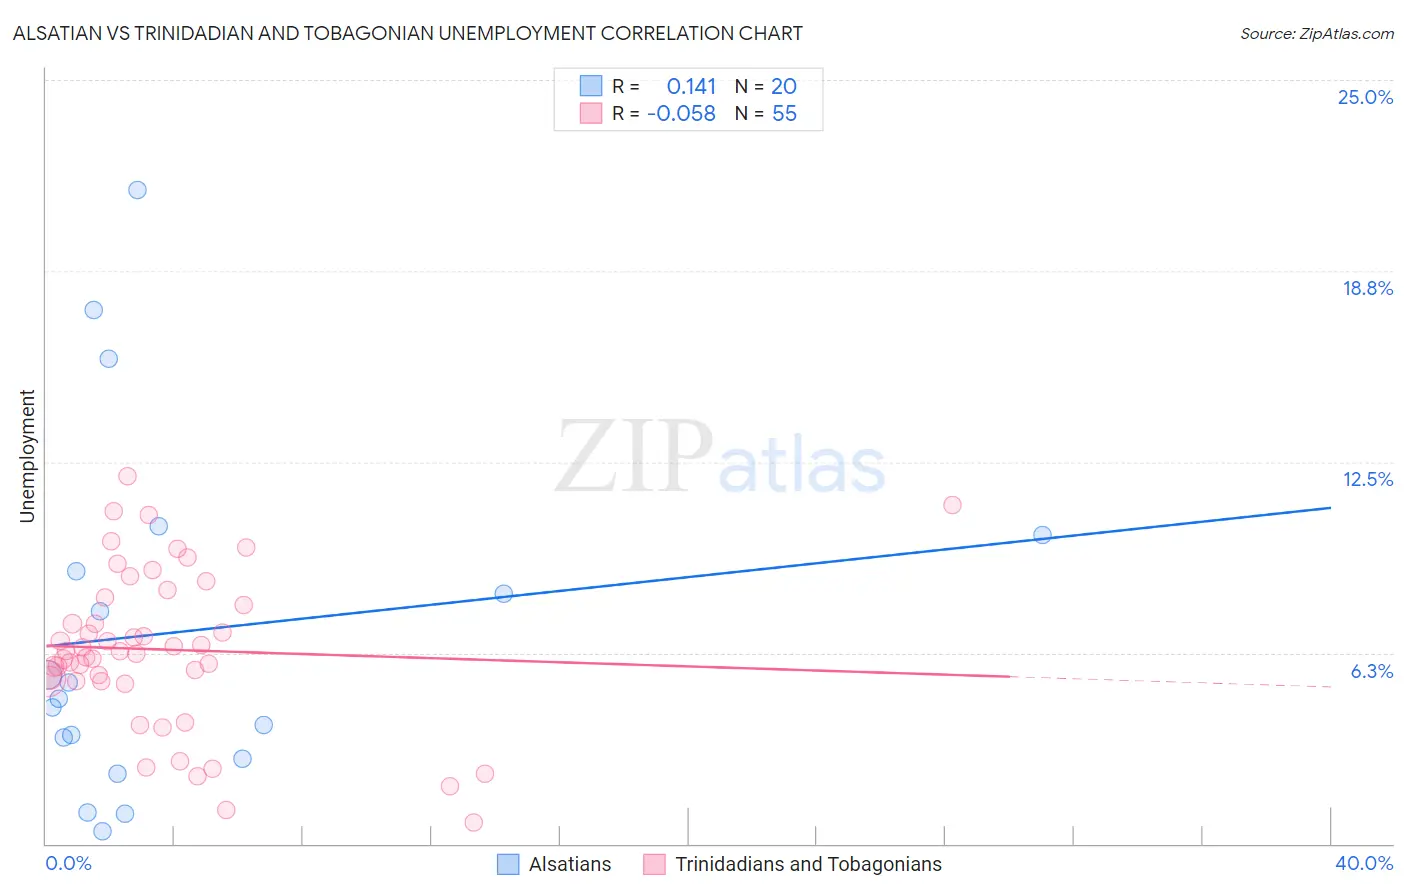
Alsatian vs Trinidadian and Tobagonian Unemployment Correlation Chart
The statistical analysis conducted on geographies consisting of 82,657,373 people shows a poor positive correlation between the proportion of Alsatians and unemployment in the United States with a correlation coefficient (R) of 0.141 and weighted average of 5.3%. Similarly, the statistical analysis conducted on geographies consisting of 219,752,630 people shows a slight negative correlation between the proportion of Trinidadians and Tobagonians and unemployment in the United States with a correlation coefficient (R) of -0.058 and weighted average of 6.3%, a difference of 19.7%.
Unemployment Correlation Summary
| Measurement | Alsatian | Trinidadian and Tobagonian |
| Minimum | 0.40% | 0.70% |
| Maximum | 21.4% | 12.0% |
| Range | 21.0% | 11.3% |
| Mean | 6.9% | 6.4% |
| Median | 5.0% | 6.3% |
| Interquartile 25% (IQ1) | 3.1% | 5.3% |
| Interquartile 75% (IQ3) | 9.5% | 8.1% |
| Interquartile Range (IQR) | 6.4% | 2.7% |
| Standard Deviation (Sample) | 5.7% | 2.6% |
| Standard Deviation (Population) | 5.6% | 2.6% |
Similar Demographics by Unemployment
Demographics Similar to Alsatians by Unemployment
In terms of unemployment, the demographic groups most similar to Alsatians are Costa Rican (5.3%, a difference of 0.020%), Immigrants from Uganda (5.3%, a difference of 0.050%), Immigrants from Belarus (5.3%, a difference of 0.090%), Arab (5.3%, a difference of 0.11%), and Immigrants from Thailand (5.3%, a difference of 0.12%).
| Demographics | Rating | Rank | Unemployment |
| Albanians | 43.5 /100 | #181 | Average 5.3% |
| Spaniards | 42.2 /100 | #182 | Average 5.3% |
| Brazilians | 40.2 /100 | #183 | Average 5.3% |
| Assyrians/Chaldeans/Syriacs | 39.2 /100 | #184 | Fair 5.3% |
| Immigrants | Thailand | 38.9 /100 | #185 | Fair 5.3% |
| Immigrants | Uganda | 37.8 /100 | #186 | Fair 5.3% |
| Costa Ricans | 37.4 /100 | #187 | Fair 5.3% |
| Alsatians | 37.0 /100 | #188 | Fair 5.3% |
| Immigrants | Belarus | 35.6 /100 | #189 | Fair 5.3% |
| Arabs | 35.3 /100 | #190 | Fair 5.3% |
| Somalis | 34.0 /100 | #191 | Fair 5.3% |
| South Americans | 33.9 /100 | #192 | Fair 5.3% |
| Immigrants | Somalia | 33.8 /100 | #193 | Fair 5.3% |
| Immigrants | Laos | 30.9 /100 | #194 | Fair 5.3% |
| Immigrants | Southern Europe | 30.9 /100 | #195 | Fair 5.3% |
Demographics Similar to Trinidadians and Tobagonians by Unemployment
In terms of unemployment, the demographic groups most similar to Trinidadians and Tobagonians are West Indian (6.4%, a difference of 0.25%), Immigrants from Trinidad and Tobago (6.3%, a difference of 0.48%), Belizean (6.4%, a difference of 0.48%), Immigrants from West Indies (6.3%, a difference of 0.60%), and Immigrants from Haiti (6.3%, a difference of 0.65%).
| Demographics | Rating | Rank | Unemployment |
| Spanish American Indians | 0.0 /100 | #294 | Tragic 6.2% |
| U.S. Virgin Islanders | 0.0 /100 | #295 | Tragic 6.3% |
| Ute | 0.0 /100 | #296 | Tragic 6.3% |
| Jamaicans | 0.0 /100 | #297 | Tragic 6.3% |
| Immigrants | Haiti | 0.0 /100 | #298 | Tragic 6.3% |
| Immigrants | West Indies | 0.0 /100 | #299 | Tragic 6.3% |
| Immigrants | Trinidad and Tobago | 0.0 /100 | #300 | Tragic 6.3% |
| Trinidadians and Tobagonians | 0.0 /100 | #301 | Tragic 6.3% |
| West Indians | 0.0 /100 | #302 | Tragic 6.4% |
| Belizeans | 0.0 /100 | #303 | Tragic 6.4% |
| Immigrants | Jamaica | 0.0 /100 | #304 | Tragic 6.4% |
| Menominee | 0.0 /100 | #305 | Tragic 6.4% |
| Lumbee | 0.0 /100 | #306 | Tragic 6.4% |
| Immigrants | Bangladesh | 0.0 /100 | #307 | Tragic 6.5% |
| Barbadians | 0.0 /100 | #308 | Tragic 6.5% |