Burmese vs Trinidadian and Tobagonian Unemployment
COMPARE
Burmese
Trinidadian and Tobagonian
Unemployment
Unemployment Comparison
Burmese
Trinidadians and Tobagonians
4.9%
UNEMPLOYMENT
98.3/ 100
METRIC RATING
72nd/ 347
METRIC RANK
6.3%
UNEMPLOYMENT
0.0/ 100
METRIC RATING
301st/ 347
METRIC RANK
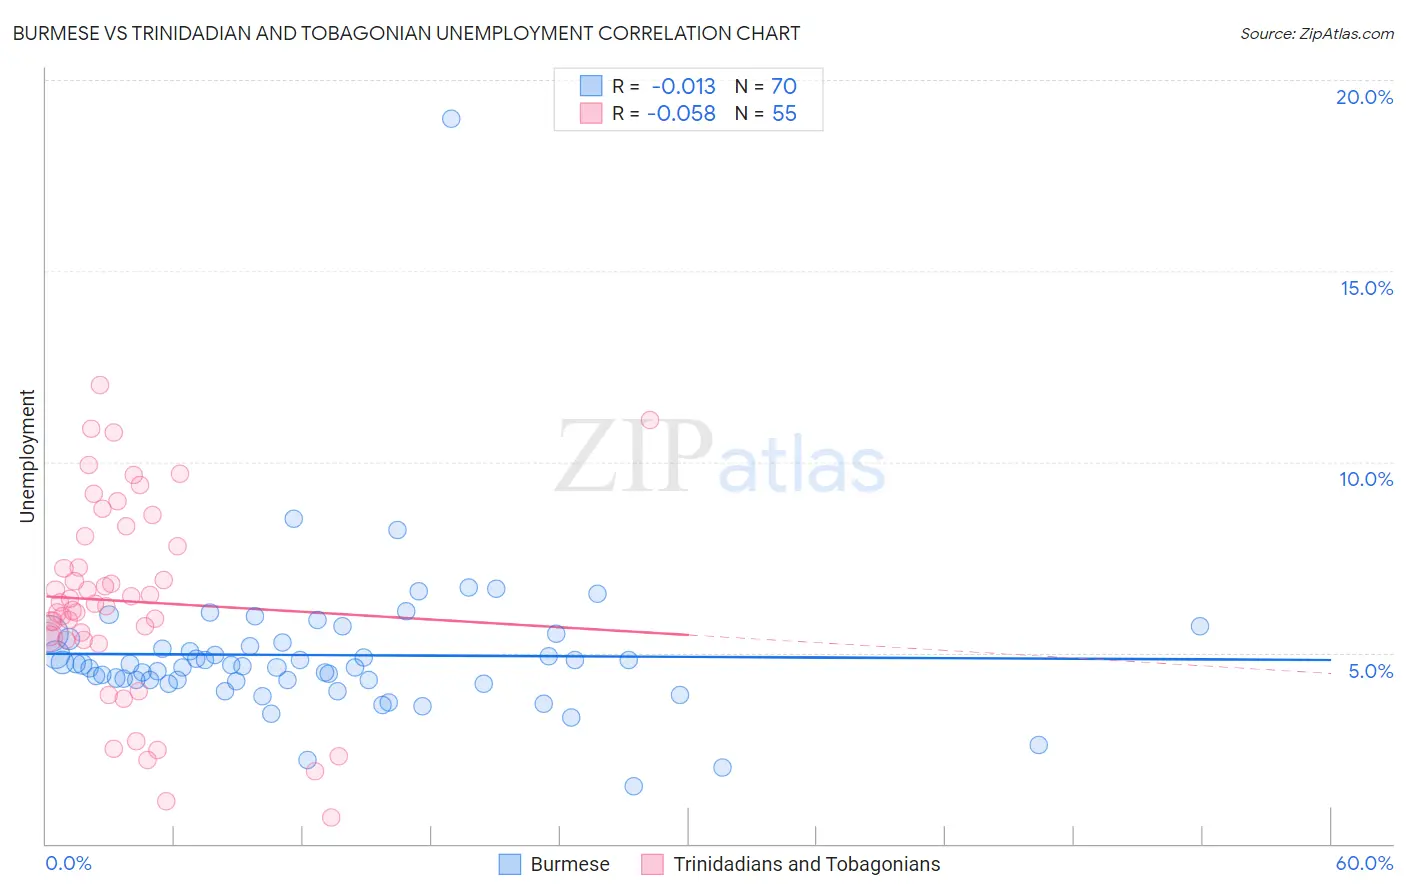
Burmese vs Trinidadian and Tobagonian Unemployment Correlation Chart
The statistical analysis conducted on geographies consisting of 464,710,374 people shows no correlation between the proportion of Burmese and unemployment in the United States with a correlation coefficient (R) of -0.013 and weighted average of 4.9%. Similarly, the statistical analysis conducted on geographies consisting of 219,752,630 people shows a slight negative correlation between the proportion of Trinidadians and Tobagonians and unemployment in the United States with a correlation coefficient (R) of -0.058 and weighted average of 6.3%, a difference of 28.7%.
Unemployment Correlation Summary
| Measurement | Burmese | Trinidadian and Tobagonian |
| Minimum | 1.5% | 0.70% |
| Maximum | 19.0% | 12.0% |
| Range | 17.5% | 11.3% |
| Mean | 4.9% | 6.4% |
| Median | 4.7% | 6.3% |
| Interquartile 25% (IQ1) | 4.3% | 5.3% |
| Interquartile 75% (IQ3) | 5.3% | 8.1% |
| Interquartile Range (IQR) | 0.98% | 2.7% |
| Standard Deviation (Sample) | 2.1% | 2.6% |
| Standard Deviation (Population) | 2.1% | 2.6% |
Similar Demographics by Unemployment
Demographics Similar to Burmese by Unemployment
In terms of unemployment, the demographic groups most similar to Burmese are Immigrants from Japan (4.9%, a difference of 0.020%), Paraguayan (4.9%, a difference of 0.040%), Serbian (4.9%, a difference of 0.080%), Immigrants from Northern Europe (4.9%, a difference of 0.14%), and Immigrants from North America (4.9%, a difference of 0.23%).
| Demographics | Rating | Rank | Unemployment |
| Immigrants | Canada | 98.8 /100 | #65 | Exceptional 4.9% |
| Slovaks | 98.7 /100 | #66 | Exceptional 4.9% |
| New Zealanders | 98.6 /100 | #67 | Exceptional 4.9% |
| Slavs | 98.6 /100 | #68 | Exceptional 4.9% |
| Immigrants | North America | 98.5 /100 | #69 | Exceptional 4.9% |
| Serbians | 98.4 /100 | #70 | Exceptional 4.9% |
| Immigrants | Japan | 98.3 /100 | #71 | Exceptional 4.9% |
| Burmese | 98.3 /100 | #72 | Exceptional 4.9% |
| Paraguayans | 98.3 /100 | #73 | Exceptional 4.9% |
| Immigrants | Northern Europe | 98.2 /100 | #74 | Exceptional 4.9% |
| Turks | 98.0 /100 | #75 | Exceptional 4.9% |
| German Russians | 98.0 /100 | #76 | Exceptional 4.9% |
| Cypriots | 97.9 /100 | #77 | Exceptional 4.9% |
| Okinawans | 97.9 /100 | #78 | Exceptional 4.9% |
| Canadians | 97.7 /100 | #79 | Exceptional 5.0% |
Demographics Similar to Trinidadians and Tobagonians by Unemployment
In terms of unemployment, the demographic groups most similar to Trinidadians and Tobagonians are West Indian (6.4%, a difference of 0.25%), Immigrants from Trinidad and Tobago (6.3%, a difference of 0.48%), Belizean (6.4%, a difference of 0.48%), Immigrants from West Indies (6.3%, a difference of 0.60%), and Immigrants from Haiti (6.3%, a difference of 0.65%).
| Demographics | Rating | Rank | Unemployment |
| Spanish American Indians | 0.0 /100 | #294 | Tragic 6.2% |
| U.S. Virgin Islanders | 0.0 /100 | #295 | Tragic 6.3% |
| Ute | 0.0 /100 | #296 | Tragic 6.3% |
| Jamaicans | 0.0 /100 | #297 | Tragic 6.3% |
| Immigrants | Haiti | 0.0 /100 | #298 | Tragic 6.3% |
| Immigrants | West Indies | 0.0 /100 | #299 | Tragic 6.3% |
| Immigrants | Trinidad and Tobago | 0.0 /100 | #300 | Tragic 6.3% |
| Trinidadians and Tobagonians | 0.0 /100 | #301 | Tragic 6.3% |
| West Indians | 0.0 /100 | #302 | Tragic 6.4% |
| Belizeans | 0.0 /100 | #303 | Tragic 6.4% |
| Immigrants | Jamaica | 0.0 /100 | #304 | Tragic 6.4% |
| Menominee | 0.0 /100 | #305 | Tragic 6.4% |
| Lumbee | 0.0 /100 | #306 | Tragic 6.4% |
| Immigrants | Bangladesh | 0.0 /100 | #307 | Tragic 6.5% |
| Barbadians | 0.0 /100 | #308 | Tragic 6.5% |