Swiss vs Trinidadian and Tobagonian Unemployment
COMPARE
Swiss
Trinidadian and Tobagonian
Unemployment
Unemployment Comparison
Swiss
Trinidadians and Tobagonians
4.5%
UNEMPLOYMENT
100.0/ 100
METRIC RATING
8th/ 347
METRIC RANK
6.3%
UNEMPLOYMENT
0.0/ 100
METRIC RATING
301st/ 347
METRIC RANK
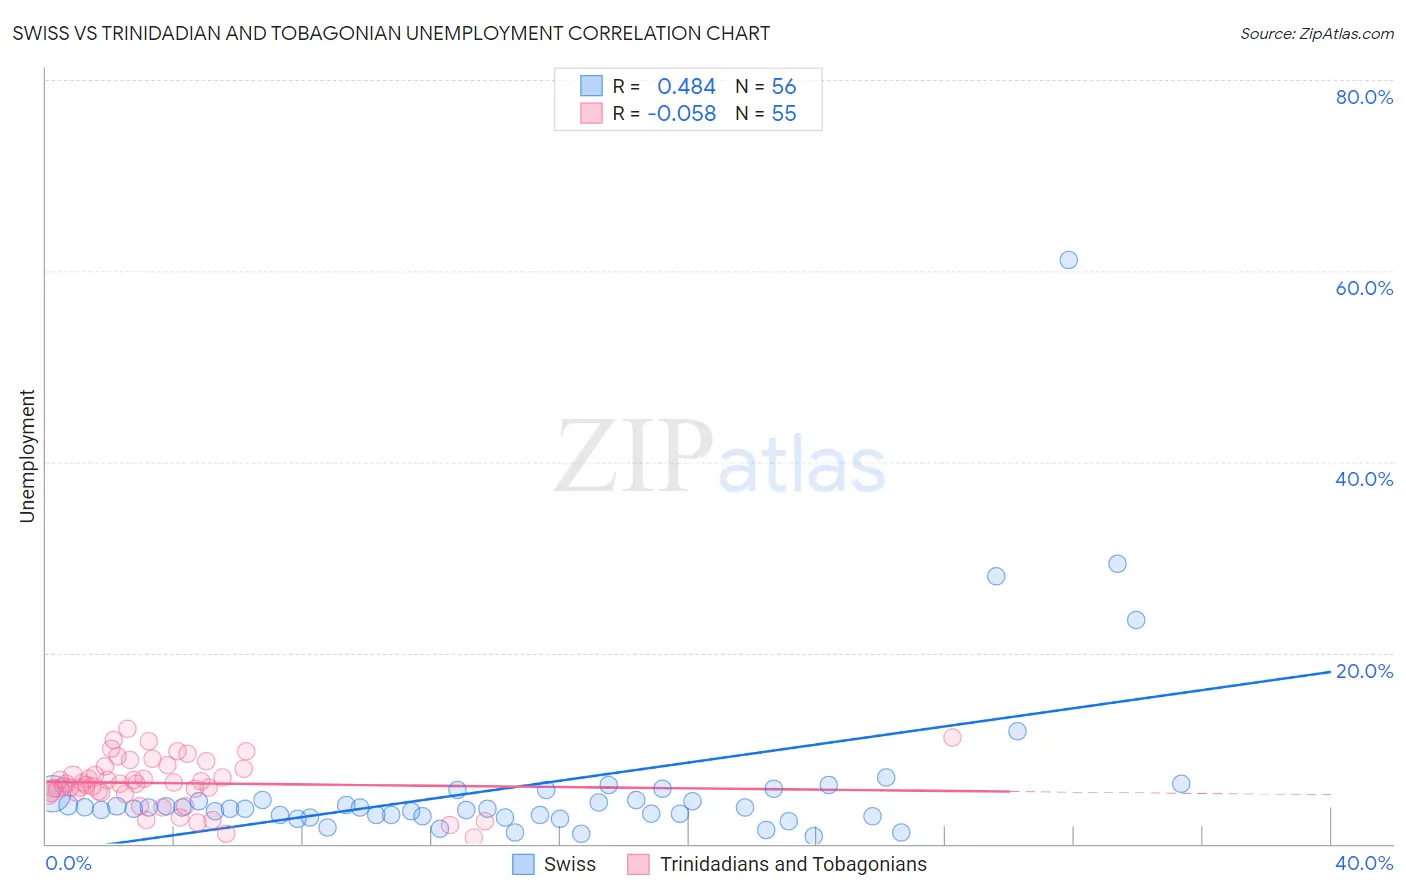
Swiss vs Trinidadian and Tobagonian Unemployment Correlation Chart
The statistical analysis conducted on geographies consisting of 463,573,695 people shows a moderate positive correlation between the proportion of Swiss and unemployment in the United States with a correlation coefficient (R) of 0.484 and weighted average of 4.5%. Similarly, the statistical analysis conducted on geographies consisting of 219,752,630 people shows a slight negative correlation between the proportion of Trinidadians and Tobagonians and unemployment in the United States with a correlation coefficient (R) of -0.058 and weighted average of 6.3%, a difference of 40.1%.
Unemployment Correlation Summary
| Measurement | Swiss | Trinidadian and Tobagonian |
| Minimum | 0.84% | 0.70% |
| Maximum | 61.1% | 12.0% |
| Range | 60.3% | 11.3% |
| Mean | 6.1% | 6.4% |
| Median | 3.7% | 6.3% |
| Interquartile 25% (IQ1) | 2.9% | 5.3% |
| Interquartile 75% (IQ3) | 4.9% | 8.1% |
| Interquartile Range (IQR) | 1.9% | 2.7% |
| Standard Deviation (Sample) | 9.3% | 2.6% |
| Standard Deviation (Population) | 9.2% | 2.6% |
Similar Demographics by Unemployment
Demographics Similar to Swiss by Unemployment
In terms of unemployment, the demographic groups most similar to Swiss are Scandinavian (4.5%, a difference of 0.39%), Immigrants from India (4.5%, a difference of 0.46%), Dutch (4.6%, a difference of 0.90%), German (4.5%, a difference of 1.0%), and English (4.6%, a difference of 1.6%).
| Demographics | Rating | Rank | Unemployment |
| Norwegians | 100.0 /100 | #1 | Exceptional 4.2% |
| Luxembourgers | 100.0 /100 | #2 | Exceptional 4.3% |
| Czechs | 100.0 /100 | #3 | Exceptional 4.3% |
| Danes | 100.0 /100 | #4 | Exceptional 4.3% |
| Swedes | 100.0 /100 | #5 | Exceptional 4.4% |
| Germans | 100.0 /100 | #6 | Exceptional 4.5% |
| Immigrants | India | 100.0 /100 | #7 | Exceptional 4.5% |
| Swiss | 100.0 /100 | #8 | Exceptional 4.5% |
| Scandinavians | 100.0 /100 | #9 | Exceptional 4.5% |
| Dutch | 100.0 /100 | #10 | Exceptional 4.6% |
| English | 100.0 /100 | #11 | Exceptional 4.6% |
| Pennsylvania Germans | 100.0 /100 | #12 | Exceptional 4.6% |
| Belgians | 100.0 /100 | #13 | Exceptional 4.6% |
| Immigrants | Cuba | 100.0 /100 | #14 | Exceptional 4.6% |
| Europeans | 99.9 /100 | #15 | Exceptional 4.6% |
Demographics Similar to Trinidadians and Tobagonians by Unemployment
In terms of unemployment, the demographic groups most similar to Trinidadians and Tobagonians are West Indian (6.4%, a difference of 0.25%), Immigrants from Trinidad and Tobago (6.3%, a difference of 0.48%), Belizean (6.4%, a difference of 0.48%), Immigrants from West Indies (6.3%, a difference of 0.60%), and Immigrants from Haiti (6.3%, a difference of 0.65%).
| Demographics | Rating | Rank | Unemployment |
| Spanish American Indians | 0.0 /100 | #294 | Tragic 6.2% |
| U.S. Virgin Islanders | 0.0 /100 | #295 | Tragic 6.3% |
| Ute | 0.0 /100 | #296 | Tragic 6.3% |
| Jamaicans | 0.0 /100 | #297 | Tragic 6.3% |
| Immigrants | Haiti | 0.0 /100 | #298 | Tragic 6.3% |
| Immigrants | West Indies | 0.0 /100 | #299 | Tragic 6.3% |
| Immigrants | Trinidad and Tobago | 0.0 /100 | #300 | Tragic 6.3% |
| Trinidadians and Tobagonians | 0.0 /100 | #301 | Tragic 6.3% |
| West Indians | 0.0 /100 | #302 | Tragic 6.4% |
| Belizeans | 0.0 /100 | #303 | Tragic 6.4% |
| Immigrants | Jamaica | 0.0 /100 | #304 | Tragic 6.4% |
| Menominee | 0.0 /100 | #305 | Tragic 6.4% |
| Lumbee | 0.0 /100 | #306 | Tragic 6.4% |
| Immigrants | Bangladesh | 0.0 /100 | #307 | Tragic 6.5% |
| Barbadians | 0.0 /100 | #308 | Tragic 6.5% |